Release time
2026-08-18 13:15 UTC
- Reference
- 2026-07-31
- Actual
- 103
- Previous
- 102.5
- Forecast
- --
Release alerts
Enter your account email. We will notify you when the next official-source USD Industrial Production release is published.
Industrial production for United States measures the output of the manufacturing, mining, and utilities sectors. It is released monthly and serves as a real-time gauge of factory activity.
Reference: 2026-07-31
Industrial output is highly sensitive to global trade volumes and commodity prices, making it especially important for commodity-linked and export-oriented economies. Sharp declines can signal the onset of a recession.
An above-consensus industrial production print is usd-supportive, particularly in economies where manufacturing is a key growth driver. Declining output may force the Federal Reserve to support the economy with rate cuts.
Industrial production measures the real output of the manufacturing, mining, and utilities sectors, indexed to a base year. It is reported monthly and is one of the highest-frequency direct measurements of physical economic activity.
Read the year-over-year change first to filter monthly noise, then the month-over-month for direction. Capacity utilisation (when published alongside) tells you how much spare capacity remains before bottlenecks fuel inflation.
Source: Federal Reserve. Cadence: Monthly. Unit: Index. History from 1999-11-30 (26.8 years).
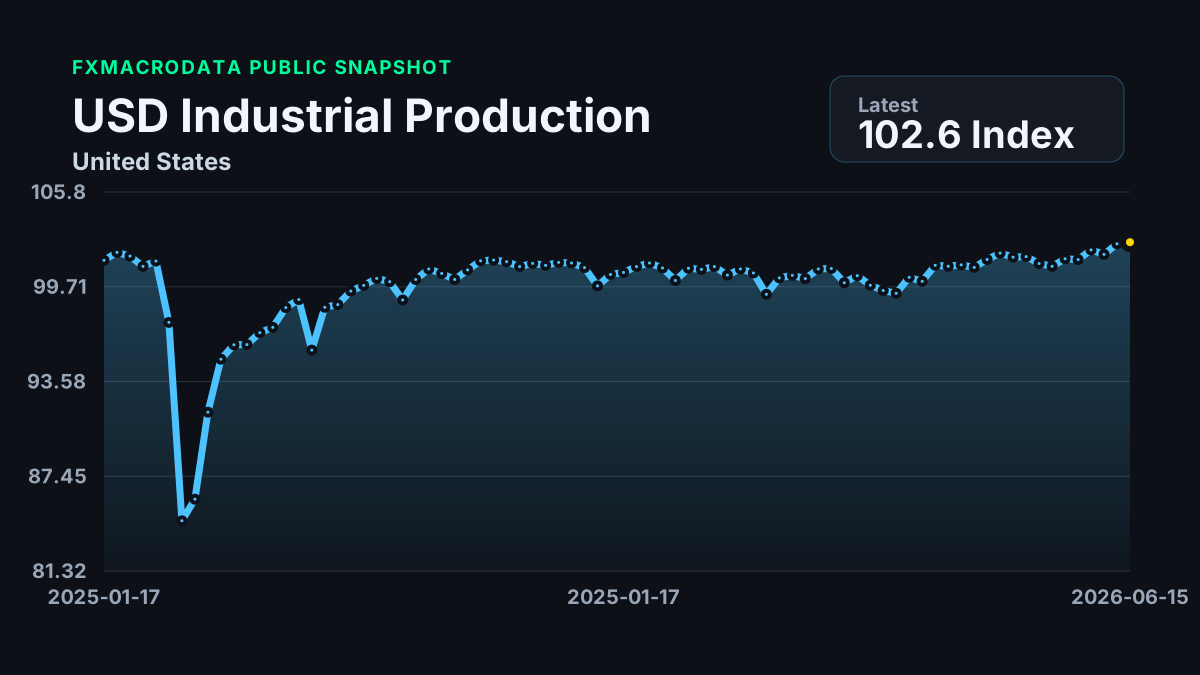
Latest release rows with direct links to the announcement detail pages.
| Release time | Reference period | Actual | Previous | Forecast | Detail |
|---|---|---|---|---|---|
|
2026-08-18 13:15 UTC
|
103 | 102.5 | -- | Announcement page | |
|
2026-06-15 13:15 UTC
|
102.5 | 102.496 | -- | Announcement page | |
|
2026-05-15 16:15 UTC
|
102.496 | 101.806 | -- | Announcement page | |
|
2026-04-16 16:15 UTC
|
101.806 | 102.101 | -- | Announcement page | |
|
2026-03-16 16:15 UTC
|
102.101 | 101.474 | -- | Announcement page | |
|
2026-02-18 16:15 UTC
|
101.474 | 101.52 | -- | Announcement page | |
|
2026-01-16 16:15 UTC
|
101.52 | 101.034 | -- | Announcement page | |
|
2025-12-03 14:15 UTC
|
101.034 | 101.219 | -- | Announcement page | |
|
2025-11-24 14:15 UTC
|
101.219 | 101.668 | -- | Announcement page | |
|
2025-11-24 14:15 UTC
|
101.668 | 101.625 | -- | Announcement page |
Developer reference, data provenance, response schema, and examples are kept on this same country indicator page so the public research page and API documentation do not compete with each other.
This page documents the exact request inputs, response fields, access model, and currently published history window for
/api/v1/announcements/usd/industrial_production.
Currently documented history runs from 1999-11-30 to 2026-07-31 for this endpoint.
Production OpenAPI schema: https://api.fxmacrodata.com/openapi.json
USD is free without a key. All other currencies require an Individual API key.
Public USD endpoint — anonymous callers receive the most recent 90 days. Add `?api_key=YOUR_API_KEY` to page through full stored USD history or to access any other currency. Date filters are applied before pagination. The default page size is 20 rows and the maximum is 100. Use either `page` or `offset`; when both are provided, `page` takes precedence. Broad windows should be traversed with `pagination.next_offset`, not split into custom shorter-window retries. If the selected series exists but a requested date window has no observations, the API returns a structured `NO_DATA_IN_REQUESTED_WINDOW` 404 with coverage dates, `recommended_start_date`, and `available_observation_count`. Forecasts are served separately by /v1/predictions/usd/industrial_production; join via `announcement_id`.
Macroeconomic announcement and catalogue rows are normalized from official central-bank, national statistics, treasury, or government publisher releases. Responses expose publisher metadata via source, source_url, and provenance fields where available.
Responses expose source, source_url, provenance, and data_quality fields for source citation, timestamp completeness, stale-data flags, and point-in-time safety checks.
Optional indicators use per-currency fetcher capability checks and may be temporarily hidden while source coverage is being remediated.
foreign_reservescb_assetsinflation_mom| Parameter | Required | Type | Description |
|---|---|---|---|
currency |
YES | string |
3-letter currency code. |
indicator |
YES | string |
Indicator slug. Use /v1/data_catalogue/{currency} to list available slugs per currency. |
| Parameter | Required | Format | Description |
|---|---|---|---|
start_date |
NO | string (YYYY-MM-DD) |
Earliest observation date to include. Date filters are applied before pagination. Authenticated requests page through full stored history when omitted; anonymous USD requests are limited to the most recent 90 days and 100 no-key requests/day. |
end_date |
NO | string (YYYY-MM-DD) |
Latest observation date to include. Defaults to today. |
limit |
NO | integer |
Maximum number of most-recent-first rows to return per page. Defaults to 20; maximum 100. |
page |
NO | integer |
One-based page number. When supplied, page takes precedence over offset; page=2 with limit=20 is equivalent to offset=20. |
offset |
NO | integer |
Zero-based row offset after date filtering. Use with pagination.next_offset to request the next page. |
api_key |
Individual (USD: no-key 100/day) | string |
Individual API key. Required for non-USD currencies and for USD requests that need history older than 90 days. |
Use start_date and end_date to narrow the series first, then page through the filtered result with limit plus either page or offset.
The default page size is 20 rows and the maximum is 100.
The response includes earliest_available_date, latest_available_date, and a pagination object with returned_count, total_count, has_more, next_offset, and page_includes_latest_available.
If the selected series exists but the requested date window has no rows, the endpoint returns 404 with error_code=NO_DATA_IN_REQUESTED_WINDOW.
| Field | Type | Description |
|---|---|---|
currency |
string |
3-letter currency code. |
indicator |
string |
Indicator slug as requested. |
has_official_forecast |
boolean |
True if the central bank publishes an official forecast for this indicator. |
start_date |
string |
Earliest date in the filtered result set (YYYY-MM-DD). |
end_date |
string |
Latest date in the filtered result set (YYYY-MM-DD). |
earliest_available_date |
string | null |
Earliest date available for this series before any date filter or pagination is applied. |
latest_available_date |
string | null |
Latest date available for this series before pagination is applied. |
requested_start_date |
string |
Start date applied to the request after endpoint defaults are resolved. |
requested_end_date |
string |
End date applied to the request after endpoint defaults are resolved. |
requested_window_has_data |
boolean |
False when the endpoint returned the latest eligible observation before the requested window instead of an observation inside the requested date range. |
page_includes_latest_available |
boolean |
True when the current page includes latest_available_date. False usually means the latest row is on a different page or the response is a historical page. |
pagination.limit |
integer |
Page size used for this response. |
pagination.offset |
integer |
Zero-based offset used for this response. |
pagination.returned_count |
integer |
Number of rows included in data[]. |
pagination.total_count |
integer |
Total number of rows matching the path and date filters before pagination. |
pagination.has_more |
boolean |
True when another page is available. |
pagination.next_offset |
integer | null |
Offset to use for the next page, or null when there are no more rows. |
pagination.page_includes_latest_available |
boolean |
Mirrors page_includes_latest_available inside the pagination envelope for clients that keep pagination state together. |
cb_target |
object | null |
Central bank target metadata (e.g. inflation target range), if applicable. |
data[].date |
string |
Observation date (YYYY-MM-DD). |
data[].announcement_id |
string |
Stable announcement identifier in the form `{currency}_{indicator}_{date}` — use it to join predictions from /v1/predictions/{currency}/{indicator} and revision history. |
data[].val |
number | null |
Observed value in the indicator's native unit. |
data[].announcement_datetime |
integer | null |
Unix timestamp (UTC) of the official data release. |
data[].pct_change |
number | null |
Period-over-period percentage change. |
data[].pct_change_12m |
number | null |
12-month rolling percentage change. |
data_quality |
object |
Standardized endpoint-level quality, source, freshness, and point-in-time safety metadata for the returned payload. |
data_quality.is_official |
boolean |
True when the response is backed by an official source and is not proxy, fallback, derived, or prohibited-source data. |
data_quality.is_proxy |
boolean |
True when the response is an explicit proxy for the requested concept rather than the primary official series. |
data_quality.is_fallback |
boolean |
True when one or more returned rows are marked as fallback data. |
data_quality.is_stale |
boolean |
True when the newest available observation is older than the endpoint's frequency-aware stale_after_days threshold. |
data_quality.has_announcement_datetime |
boolean |
True when all rows in the quality scope carry the required announcement timestamp field or fields. |
data_quality.point_in_time_safe |
boolean |
True when the result is not fallback/prohibited data and has complete release timestamps for point-in-time workflows. |
data_quality.latest_available_date |
string | null |
Freshest observation date available for the quality scope before pagination-specific caveats. |
data_quality.last_updated |
string | null |
Server-side refresh or update timestamp when the endpoint has one available. |
data_quality.data_lag_days |
integer | null |
Calendar-day lag between today and latest_available_date; null when the latest date is missing, invalid, or future-dated. |
data_quality.source_name |
string | null |
Human-readable source or publisher label used for the response. |
data_quality.source_type |
official | public | fallback | derived |
Normalized source classification shared across source-backed REST and MCP responses. |
data_quality.is_derived |
boolean |
True when the endpoint output is calculated from underlying source rows, such as spreads, slopes, forward curves, forecasts, or sentiment composites. |
data_quality.row_count |
integer |
Number of rows considered in the data-quality scope. |
data_quality.announcement_datetime_count |
integer |
Number of rows in scope with complete required announcement timestamp fields. |
data_quality.missing_announcement_datetime_count |
integer |
Number of rows in scope missing at least one required announcement timestamp field. |
data_quality.quality_scope |
string |
Scope used to compute the quality object, such as full_result, latest, recent, or scheduled_releases. |
data_quality.stale_after_days |
integer | null |
Frequency-aware threshold used for is_stale; daily=7, weekly=21, monthly=62, quarterly=125, annual=550 by default. |
source |
string |
Human-readable upstream publisher or source family for this response. |
source_url |
string | null |
Official publisher URL or source landing page when available. |
provenance |
object |
Structured provenance metadata including publisher, storage layer, served_by, timestamp field, and value field. |
source_series_name |
string | null |
Publisher's source-series label when FXMacroData stores one. |
source_local_name |
string | null |
Local-language or publisher-native series name when available. |
provenance.publisher |
string |
Official upstream publisher for the requested currency/indicator series. |
provenance.storage |
string |
FXMacroData serving storage layer for the returned payload. |
To retrieve the first page of United States Industrial Production data from 2023:
GET https://api.fxmacrodata.com/v1/announcements/usd/industrial_production?start_date=2023-01-01&end_date=2023-12-31&limit=20&page=1
import requests

url = "https://api.fxmacrodata.com/v1/announcements/usd/industrial_production"
params = {
    "start_date": "2023-01-01",
    "end_date": "2023-12-31",
    "limit": "20",
    "page": "1",
}
response = requests.get(url, params=params, timeout=20)
response.raise_for_status()
payload = response.json()

print(payload.get("data", payload))Editorial context for readers and AI agents using this page as a cited country indicator source.
Industrial Production for United States is released on a monthly schedule by Federal Reserve (or the relevant national statistics agency). FXMacroData ingests each new value within seconds of the official publication and exposes the exact announcement timestamp on every record.
The series is published in Index. The exact unit is also returned on every API response under the indicator metadata.
Data is fetched directly from Federal Reserve or the official national statistics publication for United States. The source URL is preserved on every announcement record so downstream consumers can trace the value back to its primary release.
Issue a GET request to /api/v1/announcements/usd/industrial_production?api_key=YOUR_API_KEY. The response contains a chronological list of observations with values, release dates, and announcement timestamps. USD announcement data is public; other currencies require an Individual API key.