Economic releases can trigger concentrated bursts of repricing as markets absorb a surprise. An inflation reading below expectations can change the anticipated path of interest rates; unexpectedly strong hiring can push that outlook in the opposite direction. Bitcoin and currency prices can adjust through abrupt jumps, brief reversals and further movement as trading continues.
The speed of that adjustment matters. Around the June 2024 U.S. CPI announcement, two EUR/USD quotes just 105 milliseconds apart bracket a 19.7-pip rise. Around November 2022 CPI, Bitcoin moves from 0.38% below its starting price to 1.47% above it between records 375 milliseconds apart. These subsecond bursts sit inside longer price responses. Looking only at successive one-second closes compresses the trading sequence into a pair of endpoints.
For a quant, the trading question is how much of the repricing remains after the economic surprise can be observed and an order can be filled. The release-to-price relationship supplies the economic rationale for a potential edge; its value depends on signal timing, the available price and subsequent continuation. A one-second OHLC bar preserves its high and low, but cannot show the order of trades and quotes inside that second. That sequence matters when judging whether a price was still accessible.
We examine four selected U.S. inflation and jobs releases using Binance Bitcoin perpetual-futures trades and Dukascopy EUR/USD quotes. Each case identifies the actual reading, the forecast surprise and the resulting price path. Millisecond close-ups show the initial repricing; the statistical analysis compares its size with recent trading, measures continuation over the next minute, and checks how coarser observations alter what a researcher can infer.
Measuring the price response
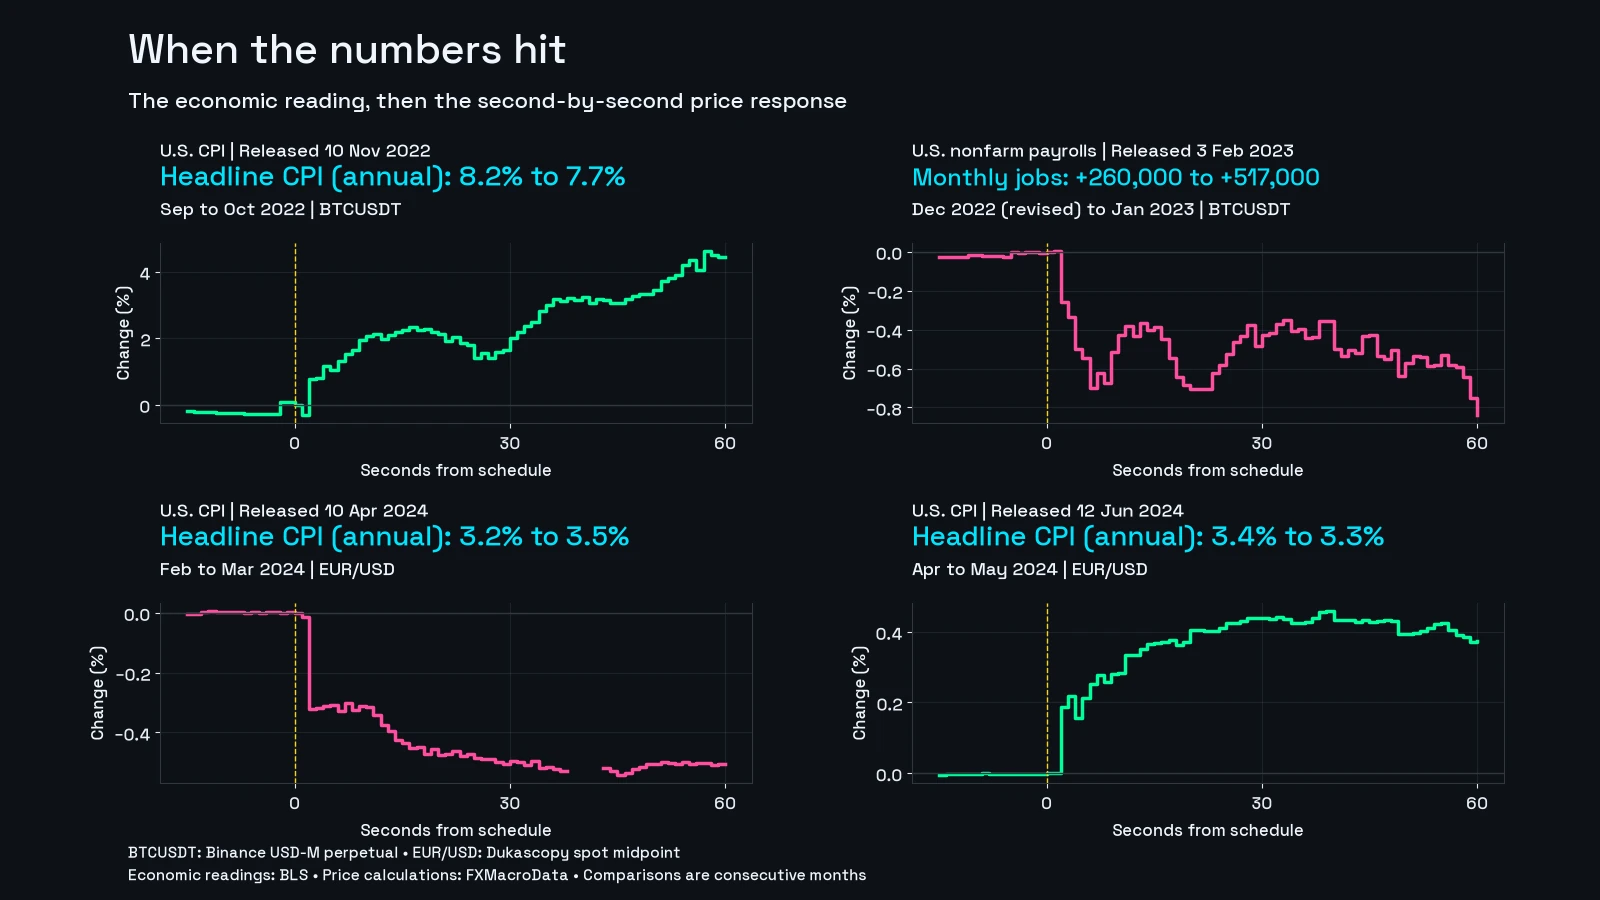
The yellow line marks the scheduled announcement, our time zero. The minute charts take the last available price at each whole second; the close-ups retain irregular source timestamps within 0–2,000 milliseconds. Prices more than 1,000 milliseconds old are omitted from the sampled charts. No intermediate trades or quotes are invented.
We distinguish three quantities. Return measures the change in the price level: R(h) = 100 × [P(h) / P(0−) − 1], where P(0−) is the last recorded price strictly before time zero. Range measures the highest minus lowest price observed during a window, divided by that same starting price. Retention measures how much of an earlier extreme or final displacement remains at a specified endpoint. A 0.76% return can coexist with a 1.85% range because the path can move in both directions.
Keep one distinction in mind as you read: a change in the economy and a surprise for the market are different things. The previous month's figure tells us whether inflation or hiring rose or fell. Economists' forecasts tell us what investors were expecting. Inflation can fall and still disappoint investors if they expected it to fall further. Each example gives both comparisons.
1. Cooling inflation, a volatile Bitcoin rally
10 November 2022: U.S. Consumer Price Index. Annual headline CPI inflation eased from 8.2% in September to 7.7% in October. Monthly headline inflation held at 0.4%, while core inflation, which excludes food and energy, slowed from 0.6% to 0.3% over the month. Prices were still rising; the annual rate of increase had slowed. Sources: the September report and October report.
The monthly headline result was below the 0.6% expected. That gave investors a reason to reconsider how aggressively the Federal Reserve would need to raise rates. Reuters reported falling Treasury yields and a weaker dollar alongside the equity rally. Bitcoin's upward move fits that broader reassessment, although the chart alone cannot prove the mechanism. Contemporaneous Reuters coverage.
The Binance USD-M BTCUSDT perpetual (a Bitcoin futures contract with no expiry date) began at 16,625.9 USDT. At two seconds it was up 0.76%, at ten seconds 2.05%, and at one minute 4.43%, reaching 17,362.6. Only 17.1% of the rise measured at one minute was present at the two-second observation. Most of the minute's advance came later.

The millisecond view complicates the simple description of a rally. An individual trade at 1,456 ms was 0.38% below the starting price; another at 1,831 ms was 1.47% above it. The first two seconds therefore contained a high-to-low price range equal to 1.85% of the starting price, despite ending only 0.76% higher. A one-second sample misses much of that turbulence.

This was also the week of the FTX crisis. Reuters' pre-release coverage described a fragile crypto market after Binance abandoned its proposed rescue of FTX. That backdrop matters: the 4.43% move is a striking example of repricing around CPI, but an unreliable guide to the size of a normal inflation response. Reuters on the pre-release market.
2. Why a strong jobs report sent Bitcoin lower
3 February 2023: U.S. Employment Situation. The initial estimate showed 517,000 nonfarm jobs added in January. December's gain was revised from 223,000 to 260,000 in the same report. The chart's 260,000-to-517,000 comparison is therefore revised December versus initial January; 260,000 was not the December figure investors knew before this release. BLS release.
The surprise becomes clearer against the Reuters poll: economists had expected 185,000 new jobs. The initial result was 332,000 above forecast, with January's gain about 2.8 times the expected number. Strong hiring suggested the economy could withstand tighter monetary policy. Reuters reported a jump in the dollar as investors reconsidered expectations for the Fed to pause. That provides a plausible explanation for Bitcoin's decline: good employment news can also mean less relief from high interest rates. Reuters forecast and market reaction.
Bitcoin started at 23,505.0 USDT. The price was nearly unchanged at one second, down 0.26% at two seconds, and down 0.84% at one minute, at 23,308.1. The opening two-second decline accounted for 31.1% of the fall measured at one minute.

The path was uneven: an early sell-off, a partial recovery, then renewed weakness. The recovery did not restore the pre-announcement price. At the end of the minute, about 95% of the largest fall from the starting price during that minute remained. That distinguishes a temporary bounce within the move from a reversal of the move itself.

The payroll number also arrived with unemployment, earnings and revisions. The price chart captures the response around the whole report. It cannot assign a separate portion of Bitcoin's decline to each statistic.
3. Hotter inflation: most of the euro's fall comes early
10 April 2024: U.S. Consumer Price Index. Annual headline inflation rose from 3.2% in February to 3.5% in March. Monthly headline and core CPI both held at 0.4%. BLS release.
Economists in the Reuters poll had expected 0.3% monthly and 3.4% annual headline inflation. Both actual readings were 0.1 percentage point higher. The implication was uncomfortable for investors anticipating rate cuts: inflation was proving harder to bring down. Treasury yields and the dollar rose as expectations for a June cut weakened. Reuters coverage.
Dukascopy's EUR/USD midpoint (the price halfway between its quoted buying and selling prices) fell from 1.086345 to 1.082845 by two seconds: 35 pips, or 0.32%. By one minute it was 1.080860, down about 55 pips, or 0.50%. A pip is 0.0001 in EUR/USD, so 35 pips means a change of 0.0035 in the exchange rate. A falling EUR/USD rate means one euro buys fewer dollars.

This was the example in which the largest share of the minute's move happened in the first two seconds. The two-second decline represented 63.8% of the price change measured at one minute. At ten seconds the decline was still only about 0.31%, before the pair resumed falling. The first jump accounted for most of the final price change; the next several seconds did not simply extend it at the same pace.

The contrast with November's Bitcoin rally is useful. Both charts show an abrupt break around an inflation announcement, but their prices settle into new levels differently. In one, most of the minute's price change comes later. In the other, almost two-thirds is already visible in the opening two seconds.
4. Softer inflation lifts the euro, then part of the gain fades
12 June 2024: U.S. Consumer Price Index. Annual headline inflation eased from 3.4% in April to 3.3% in May. Monthly headline CPI slowed from 0.3% to 0.0%, while monthly core inflation slowed from 0.3% to 0.2%. BLS release.
The monthly headline figure undershot the 0.1% increase expected in the Reuters poll. That supported expectations of eventual rate cuts, reversing the direction of April's inflation surprise. The Fed also had a policy announcement later that day, outside this one-minute window. Reuters coverage.
EUR/USD rose from 1.076660 to 1.078665 by two seconds, about 20 pips, or 0.19%. At one minute it stood at 1.080690, about 40 pips, or 0.37%, above its starting point. Almost half of that gain (49.8%) was already present at two seconds.

The initial direction persisted, but the high did not. The largest recorded midpoint gain in the minute was 0.46%, around 39 seconds. By 60 seconds, the pair had given back about 19% of that gain from the starting price, or roughly nine pips. A release can leave the market at a different level even while the immediate enthusiasm begins to fade.
The close-up pinpoints a concentrated part of the initial jump. The recorded midpoint changes from 1.076755 at 1,213 ms to 1.078725 at 1,318 ms, a rise of 19.7 pips between quotes 105 ms apart. Those coordinates are relative to the scheduled announcement. They bracket the quote change, not the publisher's release time or an execution opportunity at the earlier price. Further repricing follows, taking the minute-end gain to roughly 40 pips.

April and June provide a useful pair of observations: the same inflation measure, the same currency pair, and opposite surprises followed by opposite price movements. They are consistent with investors revising the interest-rate outlook. They do not imply that every upside or downside CPI surprise will produce the same response.
How much happened in the first two seconds?
Dividing the two-second price change by the one-minute price change gives a simple measure of how much of each move had already happened: 17.1%, 31.1%, 63.8% and 49.8%, respectively.

These percentages describe the price change from the starting point. They are not shares of trading volume or of every up-and-down movement along the way. November Bitcoin could swing sharply within two seconds and still have only 17.1% of its rise measured at one minute in place. June EUR/USD could establish roughly half its final gain early, extend it, and then retreat.
The opening jump and the subsequent path answer different questions. The jump shows how abruptly the price level changes; the later path shows whether that initial adjustment holds, extends or unwinds. A single price change measured at the end of the minute loses that distinction.
More formally, the early-displacement ratio is C = R(2s) / R(60s). It is well behaved here because all four endpoint returns have the same sign and the one-minute moves are appreciable. In another sample it could be negative, exceed 100%, or explode when the minute return is close to zero. It should not be interpreted as the fraction of information already priced in.
A separate measure compares the minute-end displacement with the largest displacement in its final direction, using every recorded observation. That ratio is 86.6% for November Bitcoin, 95.1% for February Bitcoin, 93.1% for April EUR/USD and 81.3% for June EUR/USD. All four retained most of their within-minute extreme at the endpoint. This describes persistence over 60 seconds, not permanence over the rest of the session.
How unusual were the moves compared with the preceding minute?
To see whether the opening moves stood out from recent trading, we divided the preceding minute into 30 separate two-second intervals for each case. For each interval, we compare the most recent recorded price at its start and end. Intervals with an endpoint more than one second old were excluded: all 30 remained for each Bitcoin case, 24 for April EUR/USD and 28 for June EUR/USD.
The November Bitcoin move of 0.758% was 2.2 times the largest absolute two-second move in the minute before the announcement, 0.345%. The February Bitcoin move of 0.261% was 4.9 times its largest move in the comparison period, 0.053%.
The FX contrasts were larger. April EUR/USD moved 0.322%, versus a largest move in the comparison period of 0.0175%, or 18.4 times as much. June EUR/USD moved 0.186%, versus 0.00371%, or 50.1 times as much. Those ratios partly reflect how quiet the preceding FX minutes were. A tiny comparison value can produce a very large multiple.

In every case, the opening absolute move exceeded every usable two-second move in the comparison period immediately beforehand. This supports the visual impression of an abrupt change in trading conditions. It is descriptive evidence, not a statistical significance test: neighbouring intervals are related, the comparison period is short, and the four examples were chosen after observing their reactions. The comparison cannot estimate how frequently such moves occur across all releases.
Freshness sensitivity matters. Tightening the reference-endpoint age limit from 1,000 to 500 milliseconds leaves the four event-to-maximum ratios unchanged, but reduces the FX reference counts from 24 to 20 and from 28 to 21. At 250 milliseconds only eight April and seven June intervals survive. Their ratios rise to 38.9 and 57.3 because some larger reference moves have been excluded. That is a change in the comparison sample, not stronger economic evidence. The Bitcoin ratios remain 2.2 and 4.9; the February reference count falls to 28 at the strictest limit.
What disappears when we sample the same path less often?
To isolate sampling from economics, hold the release, source records and two-second endpoint fixed. Resample each path at 10, 50, 100, 250, 500 and 1,000 millisecond intervals, always using the last observation at or before the grid point. Include time zero, 2,000 milliseconds and the pre-event starting price in every comparison. Calculate each sampled high-to-low range as a percentage of the range in the full recorded path.

November Bitcoin's full recorded range is 1.8507% of the starting price. At one-second spacing the observed range contracts to 1.0670%, retaining 57.7% of the full range and losing 42.3%. Even a 100-millisecond grid misses 31.8%; a 10-millisecond grid misses 2.0%. The two-second return stays +0.758% in every version because they share the same endpoint. Endpoint accuracy therefore does not guarantee path accuracy.
The other cases sharpen that conclusion. One-second sampling retains 99.8% of the February Bitcoin range, 99.9% of April EUR/USD's, and 89.3% of June EUR/USD's. A sustained step into a new price level is easier to capture than an extreme that reverses between observations. Sampling loss is a property of both the interval and the realised path; a single universal correction factor would not describe these four examples.
The November curve is not monotonic: the 250-millisecond grid retains 86.2%, more than the 100-millisecond grid's 68.2%. The grids hit different timestamps and neither contains the other. A coarser grid can happen to land closer to a brief extreme. This does not mean 250 milliseconds is generally superior. It means the placement of observations matters as well as their number.
The experiment concerns point samples, not properly constructed OHLC bars. Bars retaining every source high and low would preserve the range across the covered window, although they would lose the sequence within each bar. Nor is the full recorded path a complete view of the market: Binance aggregate trades are executions from one contract, while Dukascopy midpoints are quotes from one feed.
Data and reproduction
The economic values are those in the original BLS releases. Annual inflation is the 12-month change in headline CPI-U before seasonal adjustment; monthly inflation and payroll changes are seasonally adjusted. Payrolls measure jobs added during a month, not the total number of jobs. The contemporaneous Reuters forecasts provide a separate comparison with expectations.
Bitcoin uses Binance USD-M perpetual aggregate-trade records; EUR/USD uses the midpoint of Dukascopy bid and ask quotes. Each represents one venue or feed. A midpoint is not an executable trade price, and trade counts and quote counts are not directly comparable measures of market activity.
The minute charts sample the latest observation at each whole second, leaving gaps when it is more than one second old. The close-ups retain the original, irregular millisecond timestamps: they do not manufacture a price observation every millisecond. The reported highs and lows within each time window use all recorded observations, so they can exceed the extremes visible in the once-per-second samples. All percentage changes use the last price strictly before the announcement marker as their baseline.
The four scheduled anchors are 13:30:00 UTC on 10 November 2022 and 3 February 2023, and 12:30:00 UTC on 10 April and 12 June 2024, corresponding to 08:30 New York time on each date. The reference window is partitioned into 30 adjacent two-second intervals, from −60,001 to −1 milliseconds. Each reference return uses its own starting price. Exclude an interval if either as-of endpoint exceeds the stated age limit; do not replace it with another interval. Take absolute values only for the local-distribution comparison.
For the range experiment, include the pre-event reference plus all source observations from zero through 2,000 milliseconds. Preserve source order when timestamps tie; the as-of sampler takes the last tied record. Range retention is 100 × (sampled maximum − sampled minimum) / (full-path maximum − full-path minimum). The first two seconds contain 2,834 and 570 aggregate-trade records in the Bitcoin cases, and 27 and 22 quote records in the FX cases. These are records, not independent economic events.
The yellow marker is the official scheduled announcement time. The archive does not establish the exact instant the publisher made the report available, so the millisecond coordinates locate market observations relative to that schedule; they do not tell us how long the market took to react after the report actually became available.
The trading question: what remains after a feasible entry?
The economic link is visible across these cases: softer inflation accompanies upward moves in Bitcoin or EUR/USD, while stronger inflation or hiring accompanies declines. The measured responses exceed every usable two-second move in their immediately preceding reference minutes. The initial repricing can include subsecond bursts, followed by continuation and partial reversal. That creates a concrete question for news-driven research: does the surprise predict movement that remains after a feasible entry?
A tradable edge would have to survive the delay between receiving the release and reaching the market, then the bid/ask spread, fees, slippage and available liquidity. Entry must use a price obtainable after the signal becomes available. Assigning an entry at a bar's earlier open after observing information later within that bar would use hindsight. The residual price movement shown here motivates that execution test; the full announcement-window return is not the return a trader could necessarily earn.
A population claim would require a release calendar fixed before inspecting returns, including quiet and contrary cases; controls matched across dates and trading conditions; and uncertainty estimated at the announcement-date level. Three CPI reports and one jobs report cannot identify a stable return-per-unit-of-surprise coefficient. Pooling the thousands of records as independent observations would create false precision. Neither a bootstrap over these four selected dates nor a p-value against one quiet preceding minute would remove the selection problem.
The central result is that economic surprises can accompany large, concentrated price adjustments whose trading sequence unfolds within fractions of a second. The response can then extend over the following minute. The FXMacroData economic calendar provides announcement context; millisecond price records help separate the initial jump from the movement that follows. Establishing an edge requires showing that some of that subsequent movement is predictable and accessible after costs across a broader set of releases.
AI was used for research, creating graphs and editing.