
Quick answer
The yen is weak because three things changed at once: US interest rates rose far above Japan's, Japan stopped earning a trade surplus, and falling Chinese factory prices squeezed Japan's exporters. One dollar buys 158.23 yen (6 November 2026). In July the pair reached 163.86, the weakest yen since December 1986, and the yen's broad trade-weighted value fell to its lowest level in records back to 1994.
The last time the dollar bought this many yen was April 1990, and within five years it bought only 81.12. Part of that story is already turning: the Federal Reserve has cut from 5.50% to 4.00%, and the Bank of Japan has raised its rate to 1.25%, the highest since 2007. The other half is missing. In 1990 a large trade surplus stood behind the yen; today Japan still runs a deficit. The two numbers to watch are the US-Japan rate gap and Japan's trade balance.
Watch the three-minute explainer
Read the video transcript
Right now, one dollar buys a hundred and fifty-eight yen. Before 2024, the last time it bought that many was May 1990. In July, it went even further: almost a hundred and sixty-four. The weakest yen since 1986. So what happened last time? Within five years, a dollar bought just eighty-one yen. The yen had almost doubled in value. Could it happen again? Here is what the official data say changed, and what didn't.
Three things changed. First: interest rates. In 1991, a two-year US government bond paid about the same as a Japanese one. Then Japan's rates sank to zero. From 2016 until 2024, the Bank of Japan held its rate below zero. Meanwhile, US inflation hit nine point one percent in 2022, and the Fed raised its rate to five and a half. By 2023, US two-year yields paid four and a half points more than Japan's. Holding dollars paid. Holding yen didn't.
Second: trade. For thirty years, from 1981 to 2010, Japan sold the world more goods than it bought. Every single year. Since 2011, it has run a deficit in twelve of fifteen years. In 2022, a record twenty trillion yen. In the early nineties, exporters' earnings were a steady source of demand for yen. That support has faded.
Third: China. From late 2022 to early 2026, prices at Chinese factory gates fell for forty-one months in a row. Cheaper Chinese goods competed directly with Japan's own. Those prices have been rising again since March. So the yen didn't just fall against the dollar. Against a broad basket of currencies, it hit its weakest on our record, back to 1994, in July. That same month, China's yuan hit its strongest.
So, could 1990 happen again? Part of the story is already turning. The Fed's rate is down from five and a half percent to four. The Bank of Japan's is up to one and a quarter, the highest in our records back to 2007. This year, Japan's ten-year yield passed three percent for the first time since 1996. It now pays more than China's, for the first time on our record. But the other half of 1990 is missing. Back then, a big trade surplus stood behind the yen. Today, it doesn't. So watch two numbers: the rate gap between America and Japan, and Japan's trade balance. If both turn, 1990 shows how fast the yen can move. Every chart in this video is official data, on FXMacroData.
The last time the yen was this weak
The USD/JPY rate is the number of yen one US dollar buys, so a higher number means a weaker yen. On 6 November 2026 the Federal Reserve's noon reference rate was 158.23. On 29 July it reached 163.86, the weakest yen since 163.95 on 16 December 1986.
The closest comparison is April 1990, when the pair peaked at 159.9. What followed was one of the largest currency moves in modern history: by 19 April 1995 the dollar bought just 81.12 yen. Measured in dollars, the yen gained 97% in five years.
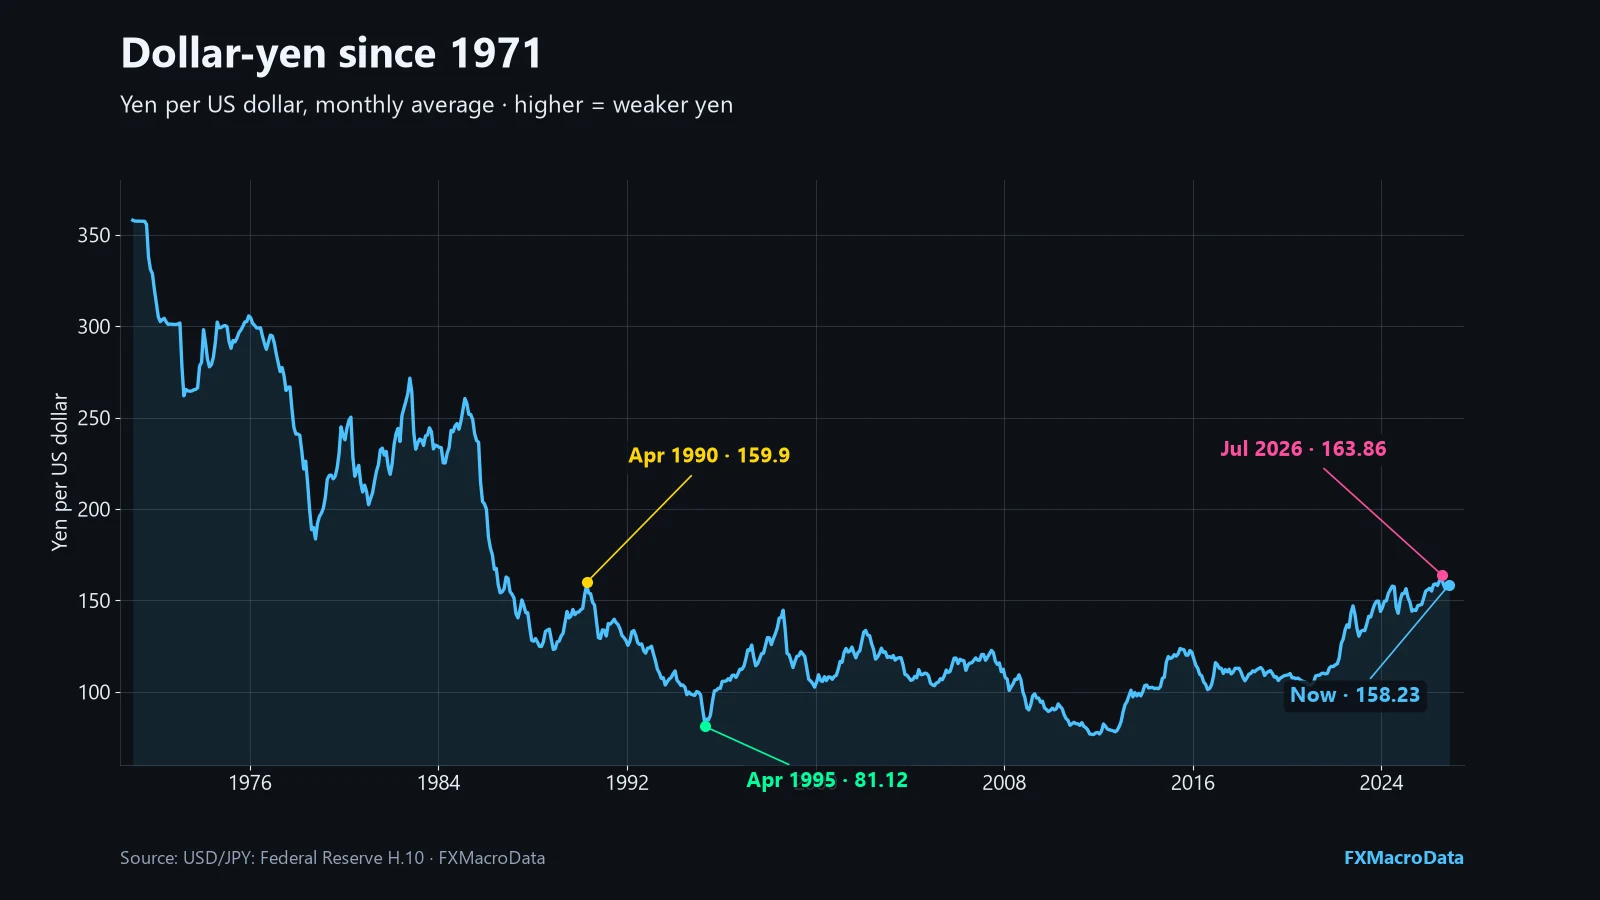
So the question is not just why the yen is weak, but whether the conditions that let it recover after 1990 are coming back. The official data point to three changes.
1. Interest rates: holding dollars paid, holding yen did not
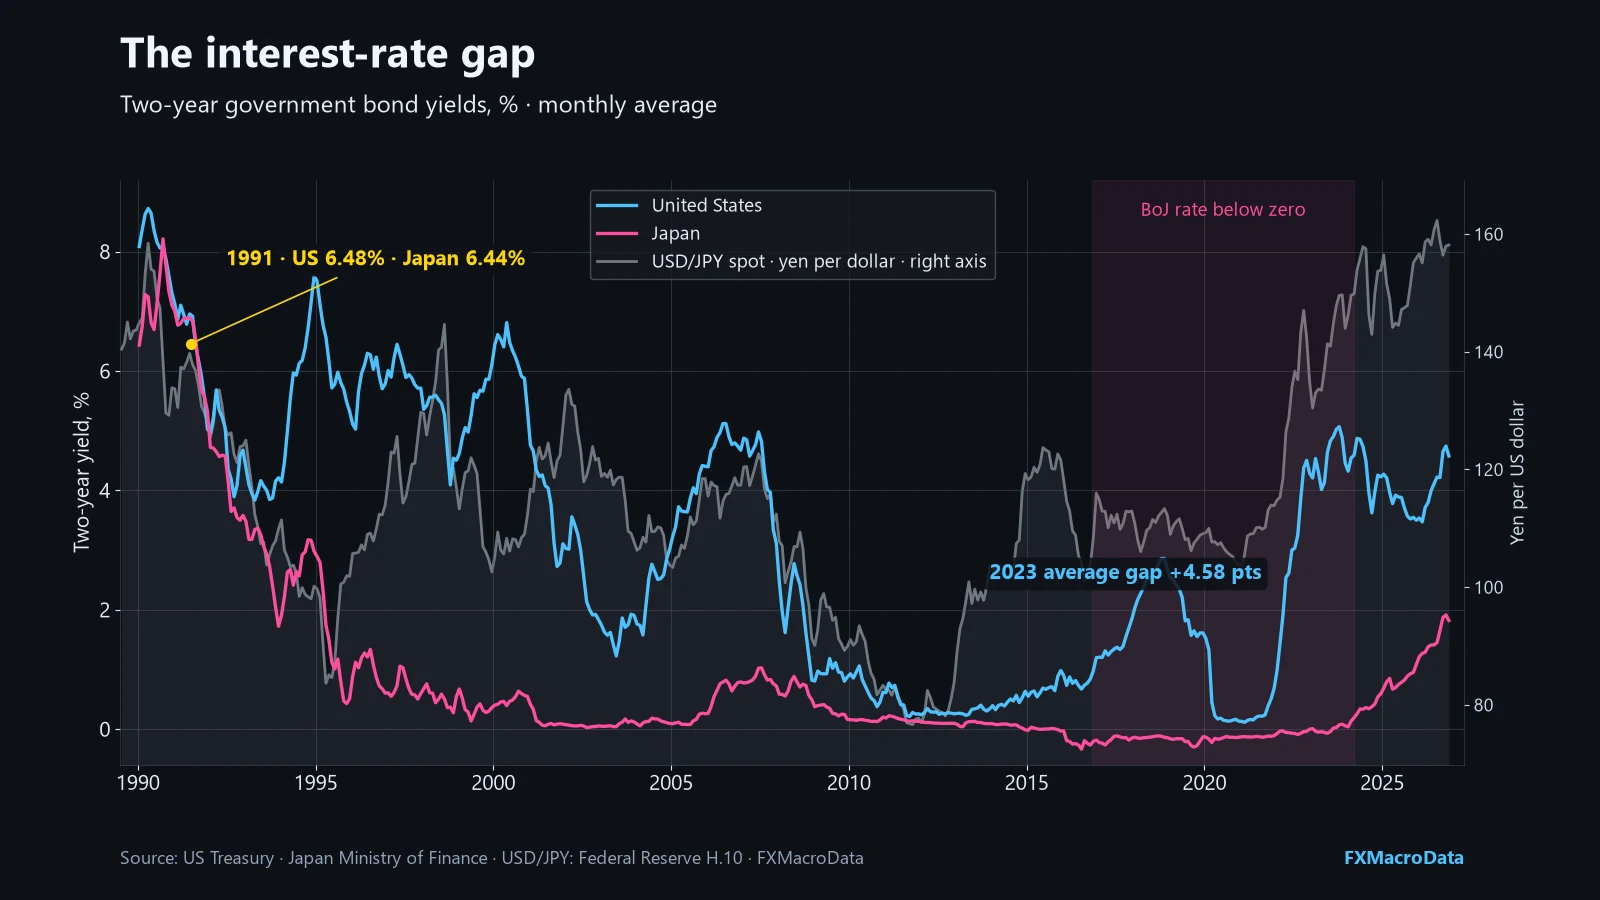
Currencies follow the return on holding them. In 1991 a two-year US Treasury note and a two-year Japanese government bond paid almost the same: 6.48% and 6.44% on annual averages. Then Japan's rates sank towards zero, and from 2016 until 2024 the Bank of Japan held its policy rate below zero.
The United States went the other way. Consumer price inflation reached 9.1% in June 2022, and the Fed raised its policy rate to a 5.50% upper bound by July 2023. Across 2023, US two-year yields averaged 4.58 percentage points above Japan's. That gap is what powers the yen carry trade: borrow in yen at close to nothing, hold dollars at 4% to 5%, and keep the difference.
2. Trade: the surplus that supported the yen has gone
When Japanese exporters sell more abroad than Japan imports, they earn foreign currency and convert much of it back into yen. That was a steady source of demand for the currency. Japan's trade balance was in surplus every single year from 1981 to 2010.
Since 2011 it has been in deficit in 12 of 15 years. In 2022, with energy import costs high and the yen already falling, the deficit hit a record ¥20.3 trillion. Over the latest twelve months it is still about ¥3.2 trillion. A country that buys more than it sells needs to sell its own currency to pay for the difference.

3. China: cheaper factory goods competed with Japan's
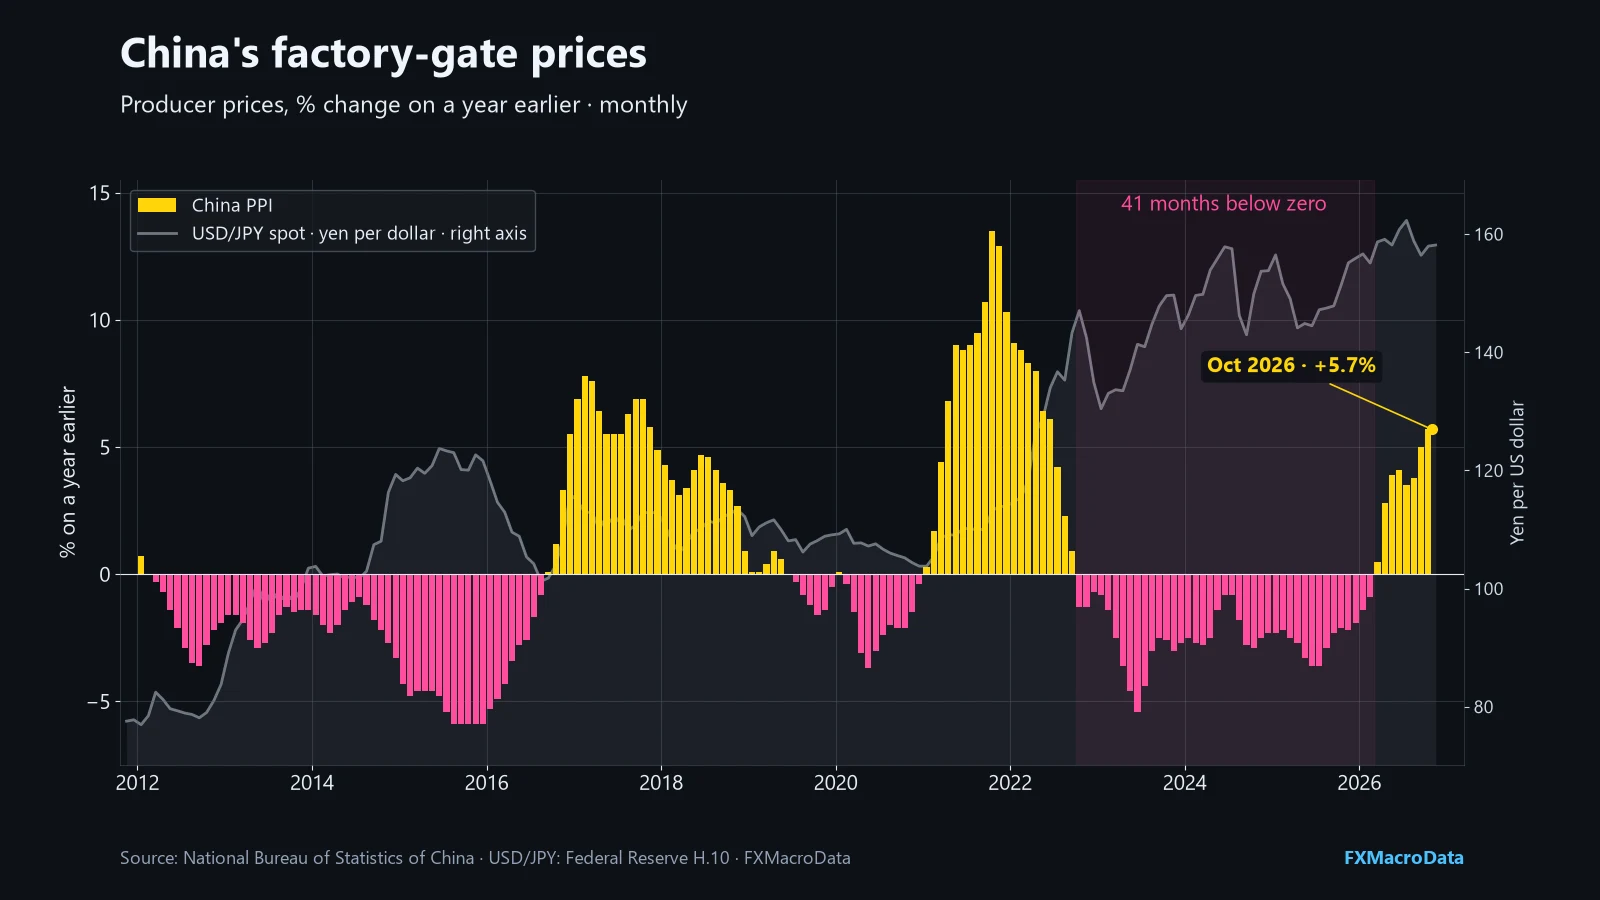
China's producer price index measures the prices factories charge as goods leave the gate. It fell year on year for 41 consecutive months, from October 2022 to February 2026. Cheaper Chinese machinery, cars and electronics competed directly with Japan's own exports in the same markets, which added to the pressure on Japan's trade.
That pressure is easing. Chinese factory-gate prices have risen again since March 2026, reaching +5.7% year on year in October.
Not just the dollar: the yen fell against everyone
A weak yen is not only a strong dollar. The Bank for International Settlements publishes nominal effective exchange rates, which measure a currency against a broad basket of trading partners. In July 2026 the yen's index fell to 67.57, its lowest on our record back to 1994. In the same month China's yuan reached 114.29, its strongest.

Could 1990 happen again?
Half of the picture is already turning. The Fed has cut its policy rate from 5.50% to 4.00% (28 October 2026). The Bank of Japan has raised its rate to 1.25% (30 October 2026), the highest in our records back to 2007. Japan's 10-year government bond yield passed 3% this year for the first time since 1996, and now pays more than China's 10-year bond for the first time on our record. The two-year gap with the US has narrowed from a 4.58 point average in 2023 to about 2.95 points.

The other half is missing. In 1990 the yen had a large and persistent trade surplus behind it, so when rate differentials turned, exporters' dollar earnings flowed back into yen. Today Japan still buys more than it sells. Narrower rate gaps reduce the reason to sell the yen; they do not by themselves create a reason to buy it.
The numbers side by side
| Driver | Early 1990s | Worst point | Now | Direction |
|---|---|---|---|---|
| USD/JPY | 159.9 (Apr 1990), then 81.12 (Apr 1995) | 163.86 (29 Jul 2026) | 158.23 (6 Nov 2026) | Off the high |
| US minus Japan two-year yield | About 0 (1991: 6.48% vs 6.44%) | +4.58 pts (2023 average) | About +2.95 pts | Narrowing |
| Fed and BoJ policy rates | Not compared here | Fed 5.50%, BoJ below zero (2023) | Fed 4.00%, BoJ 1.25% | Converging |
| Japan trade balance | Surplus every year, 1981 to 2010 | −¥20.3 tn (2022) | About −¥3.2 tn (last 12 months) | Smaller deficit, no surplus |
| China producer prices | Not a factor | 41 months below zero (Oct 2022 to Feb 2026) | +5.7% (Oct 2026) | Rising |
| Yen effective exchange rate (BIS) | Record begins 1994 | 67.57 (Jul 2026, record low) | Near the low | Weak |
What to watch
Two numbers decide whether the yen can repeat 1990:
- The US-Japan rate gap. Each Fed cut or BoJ hike narrows it. Track the two-year yields and both policy decisions on the release calendar, and the BoJ's own statements in the Japan press-release feed. For background on Japan's yield curve, see our guide to Japanese government bond yields.
- Japan's trade balance. A return to sustained monthly surpluses would restore the buyer of yen that has been missing since 2011. Without it, a narrower rate gap may slow the yen's fall rather than reverse it.
If both turn together, 1990 to 1995 shows how fast the yen can move.
Track the drivers yourself
Every series in this article is available from the FXMacroData API. This example pulls USD/JPY, both two-year yields and Japan's trade balance, then prints the latest rate gap.
import requests

BASE = "https://api.fxmacrodata.com/v1"
HEADERS = {"X-API-Key": "YOUR_API_KEY"}

def latest(path):
    rows = requests.get(f"{BASE}/{path}", headers=HEADERS, timeout=30).json()["data"]
    return max(rows, key=lambda row: row["date"])

usd_jpy = latest("forex/usd/jpy")
us_2y = latest("announcements/usd/gov_bond_2y")
jp_2y = latest("announcements/jpy/gov_bond_2y")
jp_trade = latest("announcements/jpy/trade_balance")

print("USD/JPY:", usd_jpy["val"], usd_jpy["date"])
print("US minus Japan 2y gap:", round(us_2y["val"] - jp_2y["val"], 2), "pts")
print("Japan trade balance:", jp_trade["val"], jp_trade["date"])
Field names and history ranges for each series are listed on the indicator pages.
Sources
- Federal Reserve, H.10 foreign exchange rates (USD/JPY).
- US Department of the Treasury, daily Treasury par yield curve rates (two-year yield).
- Japan Ministry of Finance, JGB interest rates (two-year and 10-year yields).
- Japan Customs, trade statistics (trade balance).
- National Bureau of Statistics of China (producer price index).
- Bank for International Settlements, effective exchange rates.
- Federal Reserve FOMC statements and Bank of Japan monetary policy decisions (policy rates).