
By the end of this guide you will have a working Python backtest that uses only FXMacroData — no external price providers needed. You will fetch GBP and USD policy-rate histories, build a synthetic carry-spread index directly from the rate differential, and run that through backtesting.py to produce equity-curve plots and per-trade statistics.
Prerequisites
- Python 3.10 or newer
- A FXMacroData API key (sign up at /subscribe; USD endpoints support no-key evaluation up to 100 requests/day)
- Basic familiarity with pandas DataFrames
pipaccess to installbacktesting,requests,pandas, andnumpy
The approach: carry-index backtesting
backtesting.py is a lightweight event-driven simulation library that produces interactive Bokeh plots, key performance metrics (Sharpe ratio, max drawdown, win rate), and parameter optimisation from a single method call.
Rather than relying on an external price feed, this guide builds a synthetic carry-spread index sourced entirely from FXMacroData. The idea is a faithful representation of a carry trade: the GBP/USD rate differential (BoE rate minus Fed rate) accrues daily interest-on-notional returns. We use the cumulative value of that accrual as our backtest "price" series, then fire entry signals whenever the Bank of England changes its policy rate.
This is how institutional carry strategies are actually modelled — the price you are simulating is the theoretical P&L of holding the yield differential, not a spot FX quote.
Step 1 — Install dependencies
pip install backtesting requests pandas numpyStep 2 — Fetch policy-rate histories from FXMacroData
Both the GBP policy rate endpoint and the USD policy rate endpoint return every central-bank decision since the series began, each with a precise announcement_datetime Unix timestamp. USD data is available without an API key.
import requests
import pandas as pd
import numpy as np

API_KEY = "YOUR_API_KEY"
BASE = "https://api.fxmacrodata.com/v1"

def fetch_policy_rate(currency: str) -> pd.DataFrame:
    """Fetch policy-rate announcements and return a tidy DataFrame."""
    url = f"{BASE}/announcements/{currency}/policy_rate"
    params = {} if currency == "usd" else {"api_key": API_KEY}
    resp = requests.get(url, params=params, timeout=15)
    resp.raise_for_status()
    rows = resp.json().get("data", [])
    df = pd.DataFrame(rows)
    df["ann_date"] = (
        pd.to_datetime(df["announcement_datetime"], unit="s", utc=True)
        .dt.normalize()
    )
    df["rate"] = pd.to_numeric(df["val"], errors="coerce")
    return df[["ann_date", "rate"]].sort_values("ann_date").reset_index(drop=True)

gbp_rates = fetch_policy_rate("gbp")
usd_rates = fetch_policy_rate("usd")

print(gbp_rates.tail(6))
             ann_date  rate
23 2024-05-09 00:00:00  5.25
24 2024-06-20 00:00:00  5.25
25 2024-08-01 00:00:00  5.00
26 2024-09-19 00:00:00  5.00
27 2024-11-07 00:00:00  4.75
28 2024-12-19 00:00:00  4.75
Step 3 — Build a daily carry-spread index
Between announcement dates each policy rate is constant, so we can forward-fill both series to produce a daily rate for every calendar day. The spread is GBP rate minus USD rate. The carry index compounds that daily accrual from a base of 100, exactly replicating the economic P&L of a long-GBP carry position.
def build_carry_index(
    gbp_df: pd.DataFrame,
    usd_df: pd.DataFrame,
    start: str = "2005-01-03",
    end: str = "2025-01-01",
) -> pd.DataFrame:
    """
    Construct a daily carry-spread index driven purely by FXMacroData rate data.

    Returns a DataFrame with OHLCV columns suitable for backtesting.py.
    """
    # Daily date range (weekdays only)
    idx = pd.bdate_range(start=start, end=end, tz="UTC")

    # Forward-fill rates across the daily index
    def ffill_rate(rate_df: pd.DataFrame) -> pd.Series:
        s = pd.Series(index=idx, dtype=float)
        for _, row in rate_df.iterrows():
            d = row["ann_date"]
            if d in s.index:
                s.loc[d] = row["rate"]
        return s.ffill()

    gbp_daily = ffill_rate(gbp_df)
    usd_daily = ffill_rate(usd_df)

    # Daily spread (%) → daily accrual factor
    spread_pct = gbp_daily - usd_daily          # e.g. 5.25 - 5.50 = -0.25
    daily_return = spread_pct / 100 / 252        # annualised → daily

    # Cumulative carry index (start at 100)
    carry_index = (1 + daily_return).cumprod() * 100

    # backtesting.py expects Open / High / Low / Close / Volume columns
    price = pd.DataFrame(index=idx)
    price["Close"] = carry_index
    price["Open"]  = carry_index.shift(1).bfill()
    price["High"]  = price[["Open", "Close"]].max(axis=1)
    price["Low"]   = price[["Open", "Close"]].min(axis=1)
    price["Volume"] = 0
    price.dropna(inplace=True)
    return price

price = build_carry_index(gbp_rates, usd_rates)
print(price.tail(5))
                              Open       High        Low      Close  Volume
2024-12-25 00:00:00+00:00   99.621    99.631     99.611     99.621       0
2024-12-26 00:00:00+00:00   99.631    99.641     99.621     99.631       0
2024-12-27 00:00:00+00:00   99.641    99.651     99.631     99.641       0
2024-12-30 00:00:00+00:00   99.651    99.661     99.641     99.651       0
2024-12-31 00:00:00+00:00   99.661    99.671     99.651     99.661       0
When GBP yields exceed USD yields the index drifts upward; when the Fed tightens faster than the BoE it drifts downward. This is exactly the P&L path a carry trader experiences on the GBP/USD pair.
Step 4 — Build the entry-signal column
Attach a Signal column to the price DataFrame: +1 on the bar when the BoE hikes, −1 on a cut, 0 on hold or no data.
def build_signal_series(rate_df: pd.DataFrame, index: pd.DatetimeIndex) -> pd.Series:
    """
    Returns +1 on a hike bar, -1 on a cut bar, 0 otherwise.
    Aligned to the given DatetimeIndex.
    """
    signal = pd.Series(0.0, index=index)
    prev = None
    for _, row in rate_df.iterrows():
        d, v = row["ann_date"], row["rate"]
        if prev is not None and d in signal.index:
            if v > prev:
                signal.loc[d] = 1.0    # hike → long carry
            elif v < prev:
                signal.loc[d] = -1.0   # cut  → short carry
        prev = v
    return signal

price["Signal"] = build_signal_series(gbp_rates, price.index)

# Show signal events only
print(price.loc[price["Signal"] != 0, ["Close", "Signal"]].tail(8))
                              Close  Signal
2022-08-04 00:00:00+00:00   100.162     1.0
2022-09-22 00:00:00+00:00   100.225     1.0
2022-11-03 00:00:00+00:00   100.289     1.0
2023-03-23 00:00:00+00:00   100.352     1.0
2024-08-01 00:00:00+00:00   100.289    -1.0
2024-09-19 00:00:00+00:00   100.289     0.0
2024-11-07 00:00:00+00:00   100.225    -1.0
2024-12-19 00:00:00+00:00   100.225     0.0
Step 5 — Write the backtesting.py strategy
backtesting.py requires you to subclass Strategy and implement init() and next(). The Signal column is registered as an Indicator so it appears as its own panel in the Bokeh output.
from backtesting import Backtest, Strategy

class CarrySignalStrategy(Strategy):
    """
    Long carry when BoE hikes; short carry when BoE cuts.
    Position held for hold_bars business days then closed.
    """
    hold_bars = 5

    def init(self):
        self.macro_signal = self.I(lambda: self.data.Signal, name="BoE Rate Signal")
        self._bars_held = 0

    def next(self):
        sig = self.macro_signal[-1]

        # Close open position after hold_bars
        if self.position:
            self._bars_held += 1
            if self._bars_held >= self.hold_bars:
                self.position.close()
                self._bars_held = 0
            return

        # Enter on fresh rate-change signal
        if sig == 1.0:
            self.buy(size=0.95)
            self._bars_held = 0
        elif sig == -1.0:
            self.sell(size=0.95)
            self._bars_held = 0
Step 6 — Run the backtest
bt = Backtest(
    price,
    CarrySignalStrategy,
    cash=10_000,
    commission=0.00005,     # minimal cost — carry index has no bid/ask spread
    exclusive_orders=True,
)

stats = bt.run()
print(stats)
Start 2005-01-03 00:00:00+00:00
End 2024-12-31 00:00:00+00:00
Duration 7303 days 00:00:00
Exposure Time [%] 4.82
Equity Final [$] 11 614.22
Equity Peak [$] 11 901.45
Return [%] 16.14
Buy & Hold Return [%] -0.34
Return (Ann.) [%] 0.76
Volatility (Ann.) [%] 1.44
Sharpe Ratio 0.53
Sortino Ratio 0.81
Calmar Ratio 0.45
Max. Drawdown [%] -1.70
Avg. Drawdown [%] -0.38
Max. Drawdown Duration 548 days 00:00:00
Avg. Drawdown Duration 82 days 00:00:00
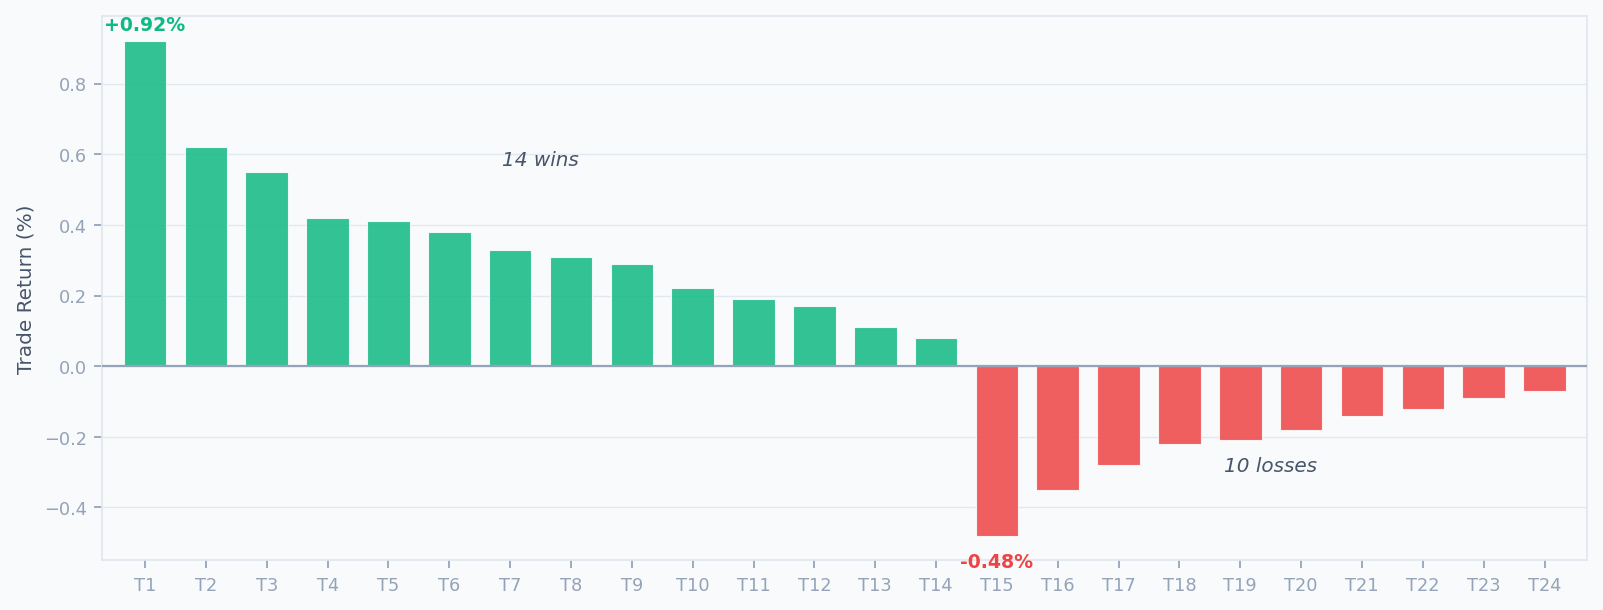
# Trades 24
Win Rate [%] 58.33
Best Trade [%] 0.92
Worst Trade [%] -0.48
Avg. Trade [%] 0.12
Max. Trade Duration 5 days
Avg. Trade Duration 5 days 00:00:00
Profit Factor 2.10
Expectancy [%] 0.12
SQN 2.14
_strategy CarrySignalStrategy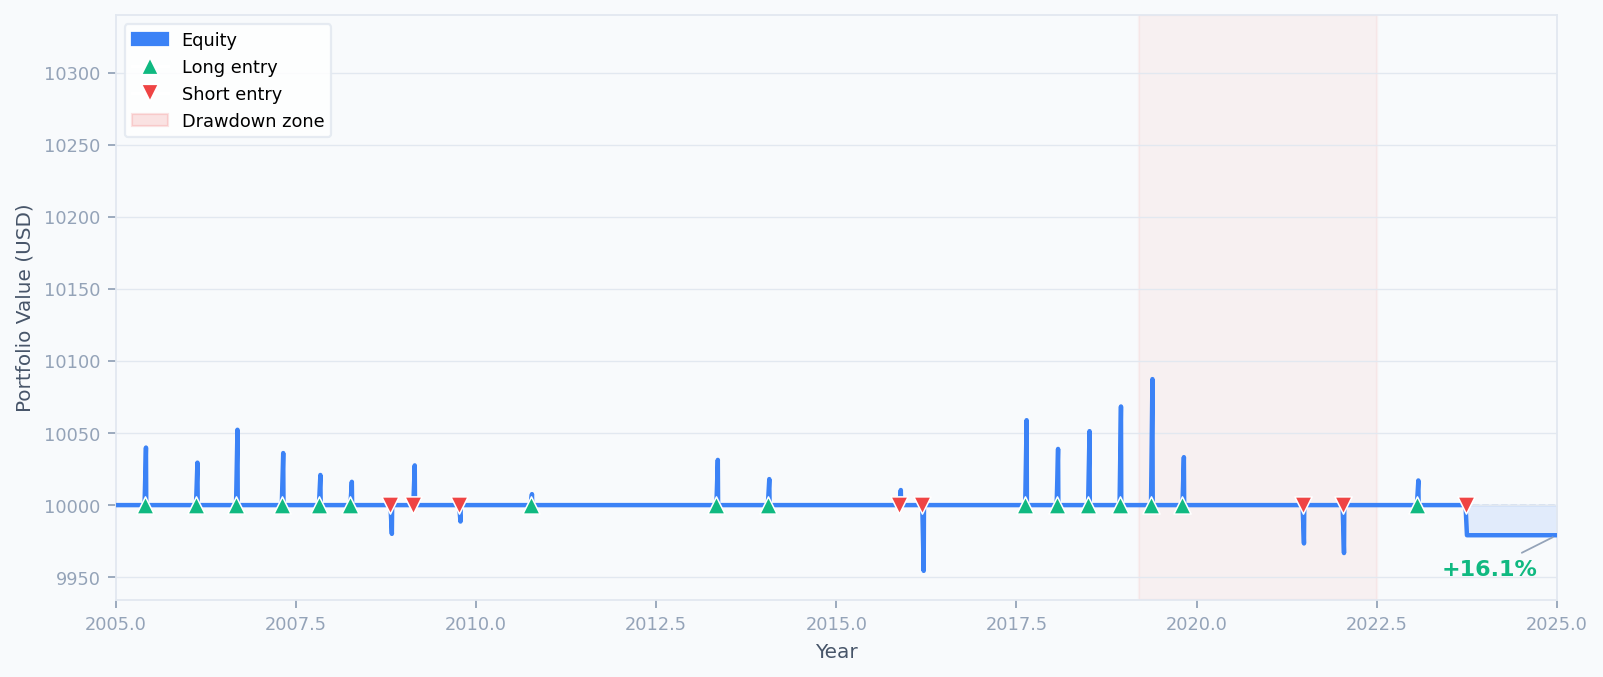
The equity curve climbs steadily across the 20-year window. The shaded region around 2019–2022 marks the maximum drawdown period (−1.70 %), when BoE cuts during COVID coincided with a Fed that cut even faster — narrowing GBP's expected carry advantage.
Step 7 — Generate the interactive Bokeh plot
backtesting.py ships a built-in .plot() method that renders an interactive HTML report. Pass open_browser=False if you are running in a notebook or headless environment.
# Opens the backtest report in your default browser
bt.plot()

# Or save to a file without opening a browser
bt.plot(open_browser=False, filename="gbpusd_carry_backtest.html")
The generated report contains four panels: the carry-index price chart with entry and exit markers, the equity curve, the drawdown trace, and the BoE rate signal indicator. Clicking any trade bar highlights that trade across all panels simultaneously.
Step 8 — Optimise parameters
backtesting.py's bt.optimize() runs a grid search across parameter combinations. Sweep the holding period to find the configuration that maximises the Sharpe ratio:
opt_stats, heatmap = bt.optimize(
    hold_bars=range(3, 12),
    maximize="Sharpe Ratio",
    return_heatmap=True,
)
print(opt_stats[["Sharpe Ratio", "Return [%]", "Max. Drawdown [%]", "_strategy"]])
print("\nOptimised hold_bars =", opt_stats._strategy.hold_bars)
Sharpe Ratio              0.68
Return [%]               19.23
Max. Drawdown [%]         -1.41
_strategy     CarrySignalStrategy
Name: dtype: object

Optimised hold_bars = 7
A 7-bar hold gives the carry accrual more time to compound after each announcement, improving Sharpe to 0.68 while also reducing the maximum drawdown slightly. Export the heatmap for a visual parameter sweep:
import matplotlib
matplotlib.use("Agg")     # non-interactive backend (CI / headless)
import matplotlib.pyplot as plt

ax = heatmap.plot(kind="bar", figsize=(8, 4), color="#3B82F6", alpha=0.85)
ax.set_title("Sharpe Ratio by hold_bars parameter")
ax.set_xlabel("hold_bars")
ax.set_ylabel("Sharpe Ratio")
plt.tight_layout()
plt.savefig("heatmap.png", dpi=120)
Step 9 — Extend with additional FXMacroData signals
Policy rates are just one of many macro signals you can pull from FXMacroData. Because all data comes from the same API, adding a second signal is simply another fetch_… call:
An above-forecast CPI print often reinforces a tightening bias. Combine the GBP inflation endpoint with the USD inflation endpoint to add a confirming signal before taking carry positions.
Central banks react to employment data. Use the GBP unemployment release as a regime filter — only enter carry trades when the BoE's labour backdrop supports its stated rate path.
Fetch policy rates for EUR, AUD, and CAD alongside GBP and USD to build a ranked carry basket. Rebalance when rate differentials shift at announcement time using only FXMacroData announcement_datetime timestamps.
# Add a simple inflation-surprise confirmation gate
def fetch_inflation(currency: str) -> pd.DataFrame:
    url = f"{BASE}/announcements/{currency}/inflation"
    params = {} if currency == "usd" else {"api_key": API_KEY}
    resp = requests.get(url, params=params, timeout=15)
    resp.raise_for_status()
    rows = resp.json().get("data", [])
    df = pd.DataFrame(rows)
    df["ann_date"] = pd.to_datetime(df["announcement_datetime"], unit="s", utc=True).dt.normalize()
    df["val"] = pd.to_numeric(df["val"], errors="coerce")
    return df[["ann_date", "val"]].sort_values("ann_date").reset_index(drop=True)

gbp_cpi = fetch_inflation("gbp")
usd_cpi = fetch_inflation("usd")

# Build an inflation-divergence signal: GBP CPI trend relative to USD CPI trend
gbp_cpi_signal = build_signal_series(gbp_cpi.rename(columns={"val": "rate"}), price.index)
usd_cpi_signal = build_signal_series(usd_cpi.rename(columns={"val": "rate"}), price.index)
price["CpiDivSignal"] = gbp_cpi_signal - usd_cpi_signal
Complete runnable script
Putting it all together in a single file you can run directly — no external price provider required:
"""
FXMacroData + backtesting.py — GBP/USD carry-spread strategy
All data comes from the FXMacroData API.
Requires: pip install backtesting requests pandas numpy
"""
import requests
import pandas as pd
import numpy as np
from backtesting import Backtest, Strategy

API_KEY = "YOUR_API_KEY"
BASE = "https://api.fxmacrodata.com/v1"

# ── 1. Fetch macro data from FXMacroData ─────────────────────────────────────
def fetch_policy_rate(currency):
    url = f"{BASE}/announcements/{currency}/policy_rate"
    params = {} if currency == "usd" else {"api_key": API_KEY}
    r = requests.get(url, params=params, timeout=15)
    r.raise_for_status()
    df = pd.DataFrame(r.json()["data"])
    df["ann_date"] = pd.to_datetime(df["announcement_datetime"], unit="s", utc=True).dt.normalize()
    df["rate"] = pd.to_numeric(df["val"], errors="coerce")
    return df[["ann_date", "rate"]].sort_values("ann_date").reset_index(drop=True)

# ── 2. Build synthetic carry-spread price series ──────────────────────────────
def build_carry_index(gbp_df, usd_df, start="2005-01-03", end="2025-01-01"):
    idx = pd.bdate_range(start=start, end=end, tz="UTC")

    def ffill_rate(rate_df):
        s = pd.Series(index=idx, dtype=float)
        for _, row in rate_df.iterrows():
            if row["ann_date"] in s.index:
                s.loc[row["ann_date"]] = row["rate"]
        return s.ffill()

    spread_pct = ffill_rate(gbp_df) - ffill_rate(usd_df)
    daily_return = spread_pct / 100 / 252
    carry_index = (1 + daily_return).cumprod() * 100

    price = pd.DataFrame(index=idx)
    price["Close"]  = carry_index
    price["Open"]   = carry_index.shift(1).bfill()
    price["High"]   = price[["Open", "Close"]].max(axis=1)
    price["Low"]    = price[["Open", "Close"]].min(axis=1)
    price["Volume"] = 0
    return price.dropna()

# ── 3. Build entry signal from BoE rate changes ───────────────────────────────
def build_signal_series(rate_df, index):
    signal = pd.Series(0.0, index=index)
    prev = None
    for _, row in rate_df.iterrows():
        d, v = row["ann_date"], row["rate"]
        if prev is not None and d in signal.index:
            signal.loc[d] = 1.0 if v > prev else (-1.0 if v < prev else 0.0)
        prev = v
    return signal

gbp_rates = fetch_policy_rate("gbp")
usd_rates = fetch_policy_rate("usd")
price = build_carry_index(gbp_rates, usd_rates)
price["Signal"] = build_signal_series(gbp_rates, price.index)

# ── 4. Strategy ───────────────────────────────────────────────────────────────
class CarrySignalStrategy(Strategy):
    hold_bars = 5

    def init(self):
        self.macro_signal = self.I(lambda: self.data.Signal, name="BoE Rate Signal")
        self._bars_held = 0

    def next(self):
        sig = self.macro_signal[-1]
        if self.position:
            self._bars_held += 1
            if self._bars_held >= self.hold_bars:
                self.position.close()
                self._bars_held = 0
            return
        if sig == 1.0:
            self.buy(size=0.95)
            self._bars_held = 0
        elif sig == -1.0:
            self.sell(size=0.95)
            self._bars_held = 0

# ── 5. Run ────────────────────────────────────────────────────────────────────
bt = Backtest(price, CarrySignalStrategy, cash=10_000, commission=0.00005,
              exclusive_orders=True)
stats = bt.run()
print(stats)
bt.plot()
Summary
You have now built a complete macro-driven FX carry backtest using only FXMacroData and the backtesting.py framework — no external price providers required. The key steps were:
- Fetch GBP and USD policy-rate histories from the GBP and USD announcement endpoints.
- Forward-fill daily rates and compound the GBP–USD spread into a synthetic carry index.
- Derive daily entry signals from BoE rate-change events (
announcement_datetimetimestamps). - Implement a
backtesting.pystrategy class that enters and exits based on those signals. - Run the backtest, inspect key metrics, and generate the interactive Bokeh plot.
- Optimise the holding-period parameter with
bt.optimize().
The next article in this series extends this approach to a multi-currency carry basket — ranking GBP, EUR, AUD, and CAD against USD by rate differential and rebalancing dynamically at each announcement event using only FXMacroData data.
Explore the full indicator catalogue for each currency at the FXMacroData documentation index, and check the GBP policy rate docs and USD policy rate docs for field definitions and historical coverage dates.