
이 가이드의 끝으로 당신은 FXMacroData를 사용하는 Python 백테스트를 사용할 수 있습니다. 외부 가격 공급자가 필요하지 않습니다. GBP와 USD 정책율 역사를 가져와, 비율 미연수에서 직접 합성 캐리 스프레드 인덱스를 만들고 실행합니다. 백테스팅.py 주식 곡선 그래프와 거래별 통계를 생산합니다.
필수 조건
- 파이썬 3.10 이상
- FXMacroData API 키 (이번에서 등록하세요) / 가입(USD 최종 지점은 무료)
- 판다와 기본적인 친숙성 데이터 프레임
pip설치할 수 있습니다backtestingrequestspandas그리고numpy
접근법: 캐리 인덱스 백트 테스트
백테스팅.py 가벼운 이벤트 기반 시뮬레이션 라이브러리로서, 하나의 메소드 호출에서 대화형 보케 그래프, 주요 성능 메트릭 (샤프 비율, 최대 드로다운, 승률) 및 매개 변수 최적화를 생성합니다.
외부 가격 공급에 의존하기보다는 이 가이드는 합성 캐리 스프레드 지수 이 아이디어는 캐리 트레이드의 충실한 표현입니다: GBP/USD 금리 차이는 (BoE 금리 미소 FED 금리) 가 상식 수익에 대한 일일 금리를 축적합니다. 우리는 그 축적의 누적 값을 백테스트 "가격" 시리즈로 사용하고, 영국 은행이 정책 금리를 변경할 때마다 화재 입시 신호를 사용합니다.
이것이 바로 기관의 캐리 전략이 실제로 모델링되는 방법입니다. 여러분이 시뮬레이션하는 가격은 수익차를 보유하는 이론적 P&L입니다. 스팟 FX 코팅이 아닙니다.
단계 1 의존성을 설치
pip install backtesting requests pandas numpyStep 2 — Fetch policy-rate histories from FXMacroData
둘 다 GBP 정책금리 최종점 그리고 USD 정책금리 최종점 이 시리즈가 시작된 이래로 중앙은행의 모든 결정을 정확하게 반환합니다. announcement_datetime 유닉스 시간표. USD 데이터는 API 키 없이 사용할 수 있습니다.
import requests
import pandas as pd
import numpy as np

API_KEY = "YOUR_API_KEY"
BASE = "https://fxmacrodata.com/api/v1"

def fetch_policy_rate(currency: str) -> pd.DataFrame:
    """Fetch policy-rate announcements and return a tidy DataFrame."""
    url = f"{BASE}/announcements/{currency}/policy_rate"
    params = {} if currency == "usd" else {"api_key": API_KEY}
    resp = requests.get(url, params=params, timeout=15)
    resp.raise_for_status()
    rows = resp.json().get("data", [])
    df = pd.DataFrame(rows)
    df["ann_date"] = (
        pd.to_datetime(df["announcement_datetime"], unit="s", utc=True)
        .dt.normalize()
    )
    df["rate"] = pd.to_numeric(df["val"], errors="coerce")
    return df[["ann_date", "rate"]].sort_values("ann_date").reset_index(drop=True)

gbp_rates = fetch_policy_rate("gbp")
usd_rates = fetch_policy_rate("usd")

print(gbp_rates.tail(6))
             ann_date  rate
23 2024-05-09 00:00:00  5.25
24 2024-06-20 00:00:00  5.25
25 2024-08-01 00:00:00  5.00
26 2024-09-19 00:00:00  5.00
27 2024-11-07 00:00:00  4.75
28 2024-12-19 00:00:00  4.75
단계 3 매일 운반 스프레드 인덱스를 구축
발표 날짜 사이 각 정책율은 일정하므로, 우리는 각 일정에 대한 일일율을 생성하기 위해 두 시리즈를 모두 앞당길 수 있습니다. 스프레드는 GBP율 미만 USD율입니다. 캐리 인덱스는 100의 기본에서 매일 축적되는 복합물이며, 긴 GBP 캐리 포지션의 경제적 P&L을 정확하게 복제합니다.
def build_carry_index(
    gbp_df: pd.DataFrame,
    usd_df: pd.DataFrame,
    start: str = "2005-01-03",
    end: str = "2025-01-01",
) -> pd.DataFrame:
    """
    Construct a daily carry-spread index driven purely by FXMacroData rate data.

    Returns a DataFrame with OHLCV columns suitable for backtesting.py.
    """
    # Daily date range (weekdays only)
    idx = pd.bdate_range(start=start, end=end, tz="UTC")

    # Forward-fill rates across the daily index
    def ffill_rate(rate_df: pd.DataFrame) -> pd.Series:
        s = pd.Series(index=idx, dtype=float)
        for _, row in rate_df.iterrows():
            d = row["ann_date"]
            if d in s.index:
                s.loc[d] = row["rate"]
        return s.ffill()

    gbp_daily = ffill_rate(gbp_df)
    usd_daily = ffill_rate(usd_df)

    # Daily spread (%) → daily accrual factor
    spread_pct = gbp_daily - usd_daily          # e.g. 5.25 - 5.50 = -0.25
    daily_return = spread_pct / 100 / 252        # annualised → daily

    # Cumulative carry index (start at 100)
    carry_index = (1 + daily_return).cumprod() * 100

    # backtesting.py expects Open / High / Low / Close / Volume columns
    price = pd.DataFrame(index=idx)
    price["Close"] = carry_index
    price["Open"]  = carry_index.shift(1).bfill()
    price["High"]  = price[["Open", "Close"]].max(axis=1)
    price["Low"]   = price[["Open", "Close"]].min(axis=1)
    price["Volume"] = 0
    price.dropna(inplace=True)
    return price

price = build_carry_index(gbp_rates, usd_rates)
print(price.tail(5))
                              Open       High        Low      Close  Volume
2024-12-25 00:00:00+00:00   99.621    99.631     99.611     99.621       0
2024-12-26 00:00:00+00:00   99.631    99.641     99.621     99.631       0
2024-12-27 00:00:00+00:00   99.641    99.651     99.631     99.641       0
2024-12-30 00:00:00+00:00   99.651    99.661     99.641     99.651       0
2024-12-31 00:00:00+00:00   99.661    99.671     99.651     99.661       0
GBP 수익률이 USD 수익률을 초과할 때 지수는 상승세를 니다. FED이 BoE보다 더 빨리 강화되면 하향세를 밟습니다. 이것은 바로 GBP/USD 쌍에서 캐리 트레이더가 경험하는 P&L 경로입니다.
단계 4 입력 신호 열을 구성
Signal 가격 열 데이터 프레임: +1 뱅크가 상승할 때 −1 상처가 났어요 0 대기 또는 데이터 없음
def build_signal_series(rate_df: pd.DataFrame, index: pd.DatetimeIndex) -> pd.Series:
    """
    Returns +1 on a hike bar, -1 on a cut bar, 0 otherwise.
    Aligned to the given DatetimeIndex.
    """
    signal = pd.Series(0.0, index=index)
    prev = None
    for _, row in rate_df.iterrows():
        d, v = row["ann_date"], row["rate"]
        if prev is not None and d in signal.index:
            if v > prev:
                signal.loc[d] = 1.0    # hike → long carry
            elif v < prev:
                signal.loc[d] = -1.0   # cut  → short carry
        prev = v
    return signal

price["Signal"] = build_signal_series(gbp_rates, price.index)

# Show signal events only
print(price.loc[price["Signal"] != 0, ["Close", "Signal"]].tail(8))
                              Close  Signal
2022-08-04 00:00:00+00:00   100.162     1.0
2022-09-22 00:00:00+00:00   100.225     1.0
2022-11-03 00:00:00+00:00   100.289     1.0
2023-03-23 00:00:00+00:00   100.352     1.0
2024-08-01 00:00:00+00:00   100.289    -1.0
2024-09-19 00:00:00+00:00   100.289     0.0
2024-11-07 00:00:00+00:00   100.225    -1.0
2024-12-19 00:00:00+00:00   100.225     0.0
단계 5 백테스팅.파이 전략을 작성
backtesting.py는 하위 클래스를 요구합니다. Strategy 그리고 실행 init() 그리고 next()- Signal 기둥이 등록되어 있습니다 Indicator 그래서 Bokeh 출력에서 자체 패널로 나타납니다.
from backtesting import Backtest, Strategy

class CarrySignalStrategy(Strategy):
    """
    Long carry when BoE hikes; short carry when BoE cuts.
    Position held for hold_bars business days then closed.
    """
    hold_bars = 5

    def init(self):
        self.macro_signal = self.I(lambda: self.data.Signal, name="BoE Rate Signal")
        self._bars_held = 0

    def next(self):
        sig = self.macro_signal[-1]

        # Close open position after hold_bars
        if self.position:
            self._bars_held += 1
            if self._bars_held >= self.hold_bars:
                self.position.close()
                self._bars_held = 0
            return

        # Enter on fresh rate-change signal
        if sig == 1.0:
            self.buy(size=0.95)
            self._bars_held = 0
        elif sig == -1.0:
            self.sell(size=0.95)
            self._bars_held = 0
단계 6 백트 테스트를 실행
bt = Backtest(
    price,
    CarrySignalStrategy,
    cash=10_000,
    commission=0.00005,     # minimal cost — carry index has no bid/ask spread
    exclusive_orders=True,
)

stats = bt.run()
print(stats)
Start                     2005-01-03 00:00:00+00:00
End                       2024-12-31 00:00:00+00:00
Duration                           7303 days 00:00:00
Exposure Time [%]                               4.82
Equity Final [$]                           11 614.22
Equity Peak [$]                            11 901.45
Return [%]                                     16.14
Buy & Hold Return [%]                          -0.34
Return (Ann.) [%]                               0.76
Volatility (Ann.) [%]                           1.44
Sharpe Ratio                                    0.53
Sortino Ratio                                   0.81
Calmar Ratio                                    0.45
Max. Drawdown [%]                              -1.70
Avg. Drawdown [%]                              -0.38
Max. Drawdown Duration          548 days 00:00:00
Avg. Drawdown Duration           82 days 00:00:00
# Trades                                           24
Win Rate [%]                                    58.33
Best Trade [%]                                   0.92
Worst Trade [%]                                 -0.48
Avg. Trade [%]                                   0.12
Max. Trade Duration                          5 days
Avg. Trade Duration                   5 days 00:00:00
Profit Factor                                   2.10
Expectancy [%]                                  0.12
SQN                                             2.14
_strategy                    CarrySignalStrategy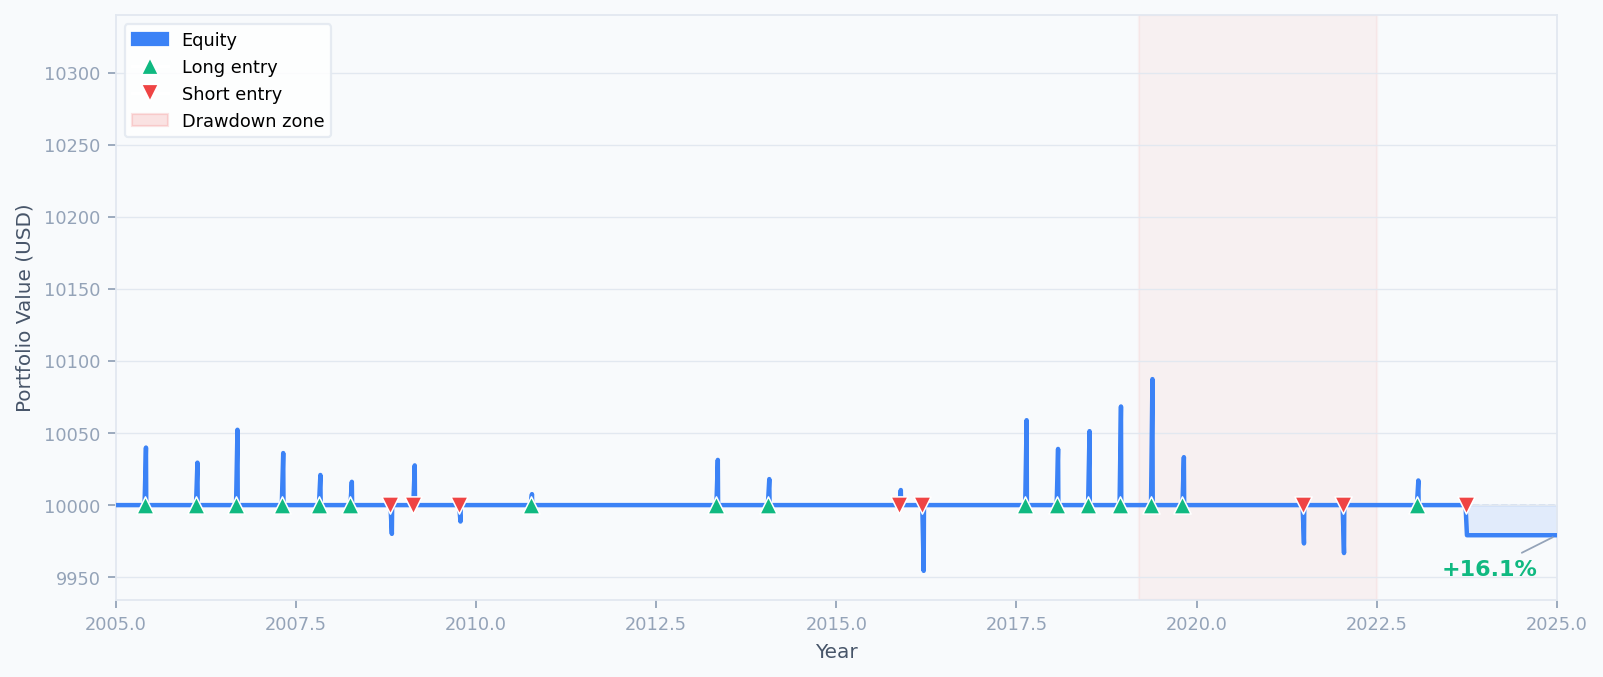
The equity curve climbs steadily across the 20-year window. The shaded region around 2019–2022 marks the maximum drawdown period (−1.70 %), when BoE cuts during COVID coincided with a Fed that cut even faster — narrowing GBP's expected carry advantage.
단계 7 상호 작용하는 Bokeh 그래프를 생성
배크테스팅.파이가 내장되어 있습니다. .plot() 상호작용적인 HTML 보고서를 렌더링하는 방법. open_browser=False 노트북이나 헤드리스 환경에서 실행하는 경우
# Opens the backtest report in your default browser
bt.plot()

# Or save to a file without opening a browser
bt.plot(open_browser=False, filename="gbpusd_carry_backtest.html")
생성된 보고서는 네 개의 패널을 포함합니다: 입출점 마커와 함께 캐리 인덱스 가격 차트, 주식 곡선, 드라우다운 트래스 및 BoE 금리 신호 표시기. 모든 패널에서 동시에 거래되는 모든 거래 표시를 클릭하면 강조됩니다.
무역 분배 차트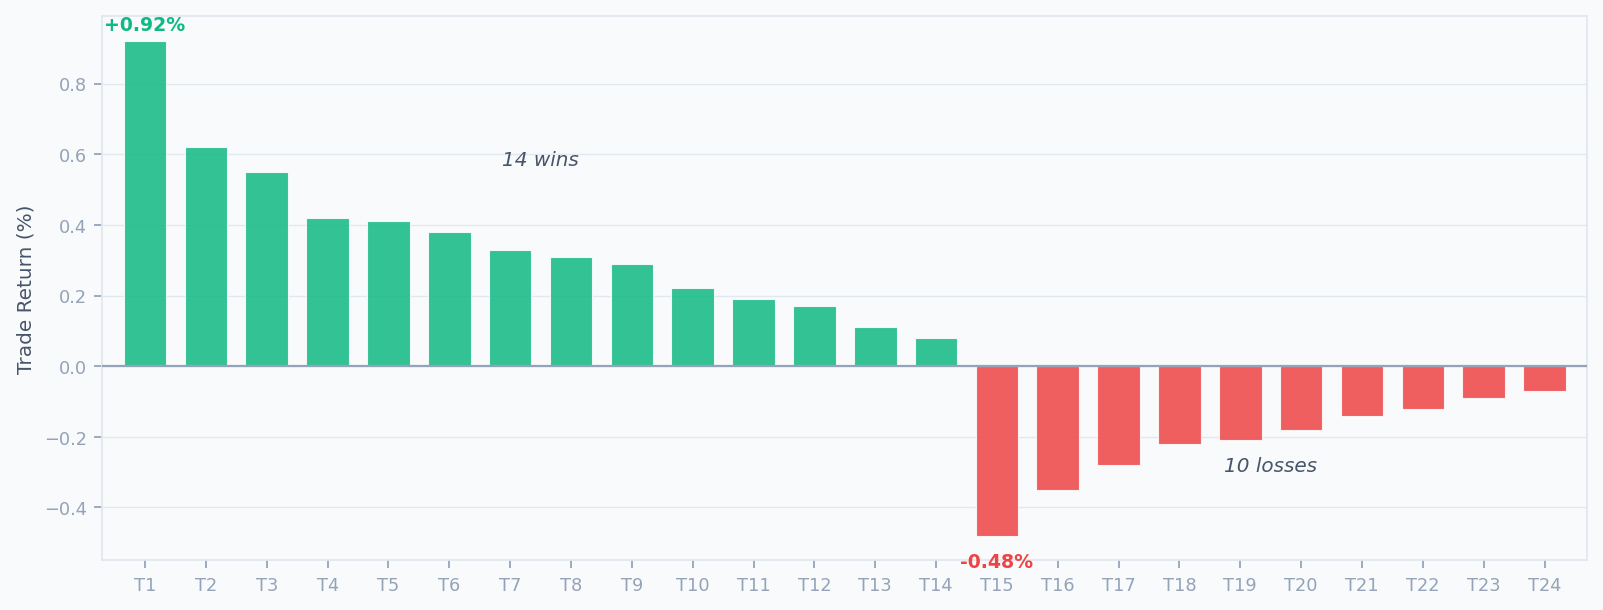
단계 8 매개 변수를 최적화
배트테스팅. bt.optimize() 매개 변수 조합을 가로 질러 격자 검색을 실행합니다. 샤프 비율을 최대화하는 구성을 찾기 위해 대기 기간을 습니다:
opt_stats, heatmap = bt.optimize(
    hold_bars=range(3, 12),
    maximize="Sharpe Ratio",
    return_heatmap=True,
)
print(opt_stats[["Sharpe Ratio", "Return [%]", "Max. Drawdown [%]", "_strategy"]])
print("\nOptimised hold_bars =", opt_stats._strategy.hold_bars)
Sharpe Ratio              0.68
Return [%]               19.23
Max. Drawdown [%]         -1.41
_strategy     CarrySignalStrategy
Name: dtype: object

Optimised hold_bars = 7
7바를 유지하면 매 발표 후에 캐리 축적이 더 많은 시간을 합성하게 되고, 샤프를 0.68으로 개선하면서 최대 마감량을 약간 줄일 수 있습니다. 시각 매개 변수 스웨이프를 위해 힐맵을 내보냅니다:
import matplotlib
matplotlib.use("Agg")     # non-interactive backend (CI / headless)
import matplotlib.pyplot as plt

ax = heatmap.plot(kind="bar", figsize=(8, 4), color="#3B82F6", alpha=0.85)
ax.set_title("Sharpe Ratio by hold_bars parameter")
ax.set_xlabel("hold_bars")
ax.set_ylabel("Sharpe Ratio")
plt.tight_layout()
plt.savefig("heatmap.png", dpi=120)
단계 9 추가 FXMacroData 신호로 확장
정책율은 FXMacroData에서 얻을 수 있는 많은 매크로 신호들 중 하나일 뿐입니다. 모든 데이터가 같은 API에서 나오는 것이기 때문에 두 번째 신호를 추가하는 것은 또 다른 신호입니다. fetch_… 전화:
예상보다 높은 CPI 인쇄는 종종 강화되는 편향을 강화합니다. GBP 인플레이션 최종점 과 함께 미국 달러 인플레이션 최종점 포지션 취하기 전에 확인 신호를 추가합니다.
중앙은행은 고용 데이터에 반응합니다. GBP 실업 지분 전환 시, 지수가 지분 변경 시,
EUR, AUD 및 CAD의 정책율을 GBP 및 USD와 함께 가져와서 순위적 캐리 카스켓을 구축합니다. FXMacroData만 사용하여 발표 시점의 지율 차이 변화가 발생하면 재균형합니다. announcement_datetime 시간표
# Add a simple inflation-surprise confirmation gate
def fetch_inflation(currency: str) -> pd.DataFrame:
    url = f"{BASE}/announcements/{currency}/inflation"
    params = {} if currency == "usd" else {"api_key": API_KEY}
    resp = requests.get(url, params=params, timeout=15)
    resp.raise_for_status()
    rows = resp.json().get("data", [])
    df = pd.DataFrame(rows)
    df["ann_date"] = pd.to_datetime(df["announcement_datetime"], unit="s", utc=True).dt.normalize()
    df["val"] = pd.to_numeric(df["val"], errors="coerce")
    return df[["ann_date", "val"]].sort_values("ann_date").reset_index(drop=True)

gbp_cpi = fetch_inflation("gbp")
usd_cpi = fetch_inflation("usd")

# Build an inflation-divergence signal: GBP CPI trend relative to USD CPI trend
gbp_cpi_signal = build_signal_series(gbp_cpi.rename(columns={"val": "rate"}), price.index)
usd_cpi_signal = build_signal_series(usd_cpi.rename(columns={"val": "rate"}), price.index)
price["CpiDivSignal"] = gbp_cpi_signal - usd_cpi_signal
실행 가능한 스크립트
모든 것을 하나의 파일로 묶어 직접 실행할 수 있습니다. 외부 가격 공급자가 필요하지 않습니다.
"""
FXMacroData + backtesting.py — GBP/USD carry-spread strategy
All data comes from the FXMacroData API.
Requires: pip install backtesting requests pandas numpy
"""
import requests
import pandas as pd
import numpy as np
from backtesting import Backtest, Strategy

API_KEY = "YOUR_API_KEY"
BASE = "https://fxmacrodata.com/api/v1"

# ── 1. Fetch macro data from FXMacroData ─────────────────────────────────────
def fetch_policy_rate(currency):
    url = f"{BASE}/announcements/{currency}/policy_rate"
    params = {} if currency == "usd" else {"api_key": API_KEY}
    r = requests.get(url, params=params, timeout=15)
    r.raise_for_status()
    df = pd.DataFrame(r.json()["data"])
    df["ann_date"] = pd.to_datetime(df["announcement_datetime"], unit="s", utc=True).dt.normalize()
    df["rate"] = pd.to_numeric(df["val"], errors="coerce")
    return df[["ann_date", "rate"]].sort_values("ann_date").reset_index(drop=True)

# ── 2. Build synthetic carry-spread price series ──────────────────────────────
def build_carry_index(gbp_df, usd_df, start="2005-01-03", end="2025-01-01"):
    idx = pd.bdate_range(start=start, end=end, tz="UTC")

    def ffill_rate(rate_df):
        s = pd.Series(index=idx, dtype=float)
        for _, row in rate_df.iterrows():
            if row["ann_date"] in s.index:
                s.loc[row["ann_date"]] = row["rate"]
        return s.ffill()

    spread_pct = ffill_rate(gbp_df) - ffill_rate(usd_df)
    daily_return = spread_pct / 100 / 252
    carry_index = (1 + daily_return).cumprod() * 100

    price = pd.DataFrame(index=idx)
    price["Close"]  = carry_index
    price["Open"]   = carry_index.shift(1).bfill()
    price["High"]   = price[["Open", "Close"]].max(axis=1)
    price["Low"]    = price[["Open", "Close"]].min(axis=1)
    price["Volume"] = 0
    return price.dropna()

# ── 3. Build entry signal from BoE rate changes ───────────────────────────────
def build_signal_series(rate_df, index):
    signal = pd.Series(0.0, index=index)
    prev = None
    for _, row in rate_df.iterrows():
        d, v = row["ann_date"], row["rate"]
        if prev is not None and d in signal.index:
            signal.loc[d] = 1.0 if v > prev else (-1.0 if v < prev else 0.0)
        prev = v
    return signal

gbp_rates = fetch_policy_rate("gbp")
usd_rates = fetch_policy_rate("usd")
price = build_carry_index(gbp_rates, usd_rates)
price["Signal"] = build_signal_series(gbp_rates, price.index)

# ── 4. Strategy ───────────────────────────────────────────────────────────────
class CarrySignalStrategy(Strategy):
    hold_bars = 5

    def init(self):
        self.macro_signal = self.I(lambda: self.data.Signal, name="BoE Rate Signal")
        self._bars_held = 0

    def next(self):
        sig = self.macro_signal[-1]
        if self.position:
            self._bars_held += 1
            if self._bars_held >= self.hold_bars:
                self.position.close()
                self._bars_held = 0
            return
        if sig == 1.0:
            self.buy(size=0.95)
            self._bars_held = 0
        elif sig == -1.0:
            self.sell(size=0.95)
            self._bars_held = 0

# ── 5. Run ────────────────────────────────────────────────────────────────────
bt = Backtest(price, CarrySignalStrategy, cash=10_000, commission=0.00005,
              exclusive_orders=True)
stats = bt.run()
print(stats)
bt.plot()
요약
이제 당신은 단지 FXMacroData와 backtesting.py 프레임워크를 사용하여 완전한 매크로 구동 FX 운반 백테스트를 구축했습니다. 외부 가격 공급자가 필요하지 않습니다. 주요 단계는 다음과 같습니다.
- GBP와 USD 정책금리 역사 자료를 GBP 그리고 미국 달러 발표 최종점
- 전속 채용 일일율을 합쳐서 GBPUSD 스프레드를 합성 캐리 인덱스로 구성합니다.
- 뱅크의 환율 변화 이벤트로부터 매일 입시 신호를 추출 (
announcement_datetime시간표) - 실행
backtesting.py그 신호에 따라 입력하고 종료하는 전략 클래스 - 백테스트를 실행하고, 주요 메트릭을 검사하고, 대화형 보케 그래프를 생성합니다.
- 로 유지 기간 매개 변수를 최적화
bt.optimize()- 그래요
이 시리즈 의 다음 기사 에서는 이 접근 방식 을 다화폐 운반구 GBP, EUR, AUD 및 CAD를 USD에 대한 환율 차이에 따라 순위화하고 FXMacroData 데이터만을 사용하여 각 발표 이벤트에서 동적으로 재균형합니다.
각 통화에 대한 전체 지표 카탈로그를 FXMacroData 문서 지표그리고 확인해 GBP 정책금리 문서 그리고 미국 달러 정책금리 문서 필드 정의와 역사적인 커버리지 날짜를 위해.